Industrial Properties
3715 Davinci Court, 300 Norcross, GA 30092
3715 Davinci Court, 300 Norcross, GA 30092

Details & Description
Property Highlights
• Accessible via Hwy. 141 Peachtree Parkway and Peachtree Industrial Blvd., 10 minutes from I-285
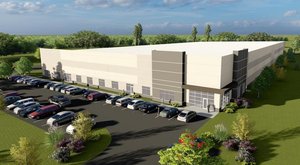
• Classic architectural-style exterior, with upscale, common-area interior finishes
Listing Agents

Wes Hardy
Duke Realty
O: 770-638-2522
wes.hardy@dukerealty.com
Duke Realty
O: 770-638-2522
wes.hardy@dukerealty.com
While we strive to provide the most accurate information, all listing information, and demographic data, is provided by third-parties. As such, MyEListing will not be responsible for the accuracy of the information. It is strongly recommended that you verify all information with the listing agent, and any relevant agencies, prior to making any decisions.