Office Space
620 Freedom Business Center Drive King Of Prussia, PA 19406
620 Freedom Business Center Drive King Of Prussia, PA 19406
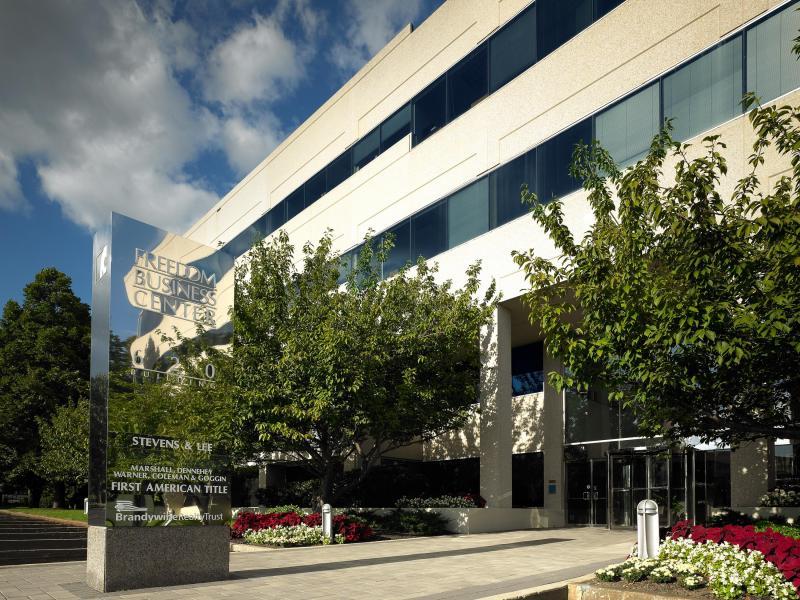
Details & Description
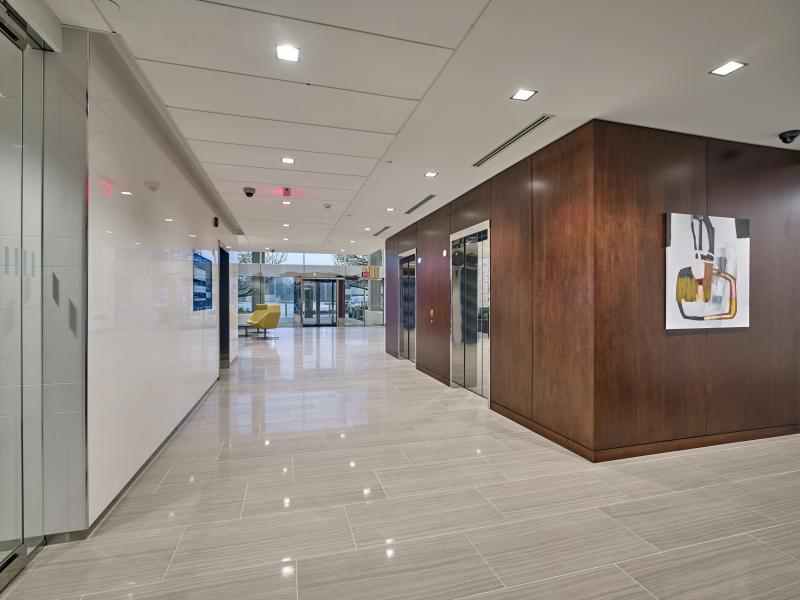
Property Highlights
• New renovated Independence Deli facility on-site offering food and dining options
• New State of the art fitness center with locker rooms and showers
Listing Agents

Kathy Sweeney-Pogwist
O: 610-832-7743
kathy.sweeney-pogwist@bdnreit.com
O: 610-832-7743
kathy.sweeney-pogwist@bdnreit.com
While we strive to provide the most accurate information, all listing information, and demographic data, is provided by third-parties. As such, MyEListing will not be responsible for the accuracy of the information. It is strongly recommended that you verify all information with the listing agent, and any relevant agencies, prior to making any decisions.