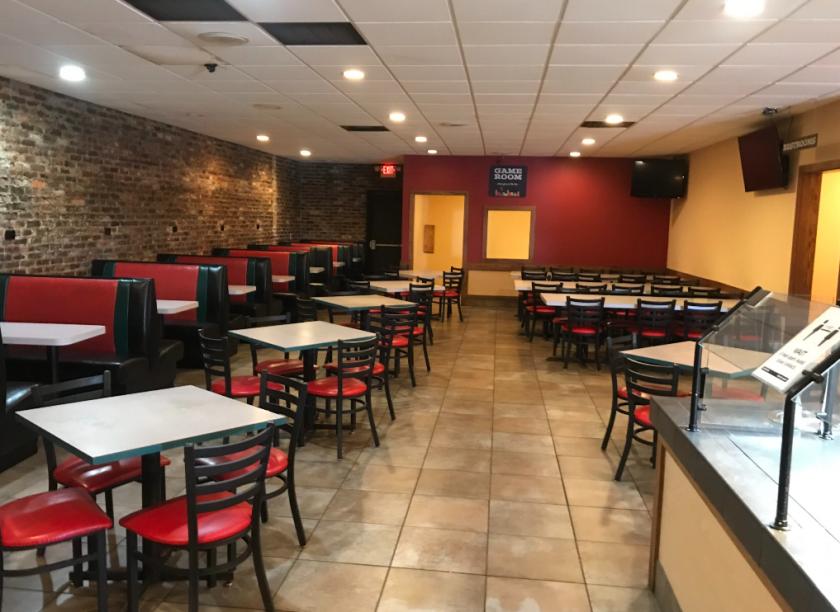
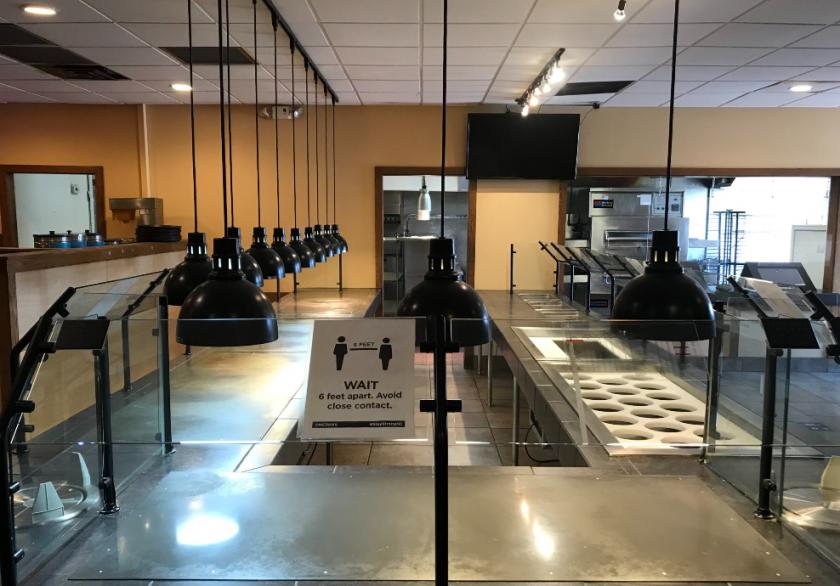
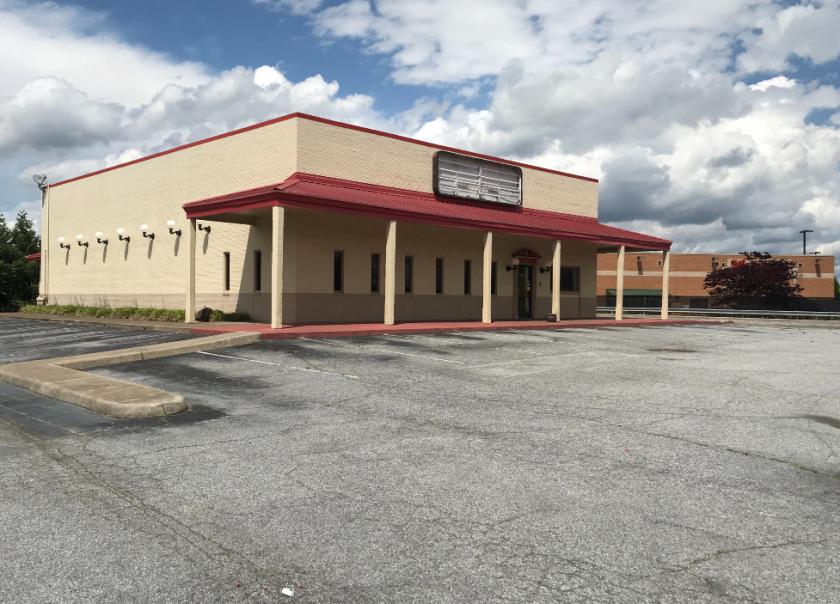
1-Mile | 3-Miles | 5-Miles | ||
---|---|---|---|---|
Total Population | 4,290 | 36,126 | 90,191 | |
Population Median Age | 38 | 37 | 38 | |
Population by Age | 0-9 Yrs | 551 (12%) | 5091 (14%) | 11743 (13%) |
10-19 Yrs | 545 (12%) | 4975 (13%) | 13469 (14%) | |
20-29 Yrs | 600 (13%) | 5245 (14%) | 12876 (14%) | |
30-39 Yrs | 675 (15%) | 4478 (12%) | 10277 (11%) | |
40-49 Yrs | 464 (10%) | 4151 (11%) | 10637 (11%) | |
50-59 Yrs | 492 (11%) | 4631 (12%) | 12292 (13%) | |
60-69 Yrs | 577 (13%) | 4040 (11%) | 9252 (10%) | |
70+ Yrs | 386 (8%) | 3516 (9%) | 9644 (10%) | |
Median HH Income | $38,673 | $33,796 | $39,073 | |
Total Household Income | < 24K | 513 (31%) | 5040 (37%) | 10364 (31%) |
25-49K | 599 (36%) | 4386 (32%) | 10088 (30%) | |
50-74K | 304 (18%) | 2047 (15%) | 5446 (16%) | |
75-99K | 115 (7%) | 904 (6%) | 3197 (9%) | |
100-199K | 95 (5%) | 923 (6%) | 3589 (10%) | |
200K+ | 7 (0%) | 118 (0%) | 642 (1%) | |
Highest Education Level | No Diploma | 645 | 6585 | 12250 |
Diploma or GED | 1089 | 7484 | 17161 | |
Some College | 660 | 5350 | 13441 | |
Assoc. Degree | 220 | 1592 | 4726 | |
Bachelors Degree | 299 | 2065 | 7453 | |
Higher Degree | 59 | 725 | 3233 | |
Total Housing Units | 1,778 | 15,611 | 37,977 | |
--Owner-Occupied | 705 | 5,594 | 18,107 | |
--Renter-Occupied | 928 | 7,823 | 15,219 | |
Owner-Occupied Values | < 100K | 415 | 2832 | 6776 |
100-199K | 209 | 2176 | 8202 | |
200-299K | 52 | 492 | 2141 | |
300-399K | 0 | 19 | 380 | |
400-499K | 17 | 31 | 243 | |
500K+ | 11 | 44 | 365 | |
Total Working Age Population | 3,402 | 28,183 | 71,480 | |
In Work Force | 2,098 | 16,325 | 42,268 | |
Not In Work Force | 1,305 | 11,858 | 29,212 | |
Workforce Employed | 1,944 | 14,648 | 38,617 | |
Workforce Unemployed | 153 | 1,615 | 3,542 | |
Civlian Workforce | 2,098 | 16,263 | 42,160 | |
Military Workforce | 0 | 62 | 109 | |
Total Households | 1,633 | 13,417 | 33,326 | |
Family Households | 950 | 8,484 | 21,767 | |
Non-Family Households | 683 | 4,933 | 11,560 | |
Married Couple | 495 | 4,271 | 12,870 | |
Other Family | 454 | 4,213 | 8,897 | |
Married w/Child | 183 | 1,499 | 4,765 | |
Single Male w/Child | 34 | 587 | 990 | |
Single Female w/Child | 188 | 1,883 | 4,085 |
Population Change Last Two Decades - Plus Projection
2000 | % | 2010 | % | 2020 | % | 2030 | |
---|---|---|---|---|---|---|---|
North Carolina | 8,049,313 | +18 | 9,535,483 | +11 | 10,630,691 | +11 | 11,836,070 |
Davidson County | 147,246 | +11 | 162,878 | +5 | 170,888 | +8 | 184,987 |
Forsyth County | 306,067 | +15 | 350,670 | +9 | 383,123 | +9 | 418,257 |
Guilford County | 421,048 | +16 | 488,406 | +12 | 545,348 | +13 | 615,227 |
Randolph County | 130,454 | +9 | 141,752 | +3 | 145,807 | +6 | 154,739 |
Total Working Age Population:
Total Households:
Total Working Age Population:
Total Households:
Total Working Age Population:
Total Households: