Industrial Properties
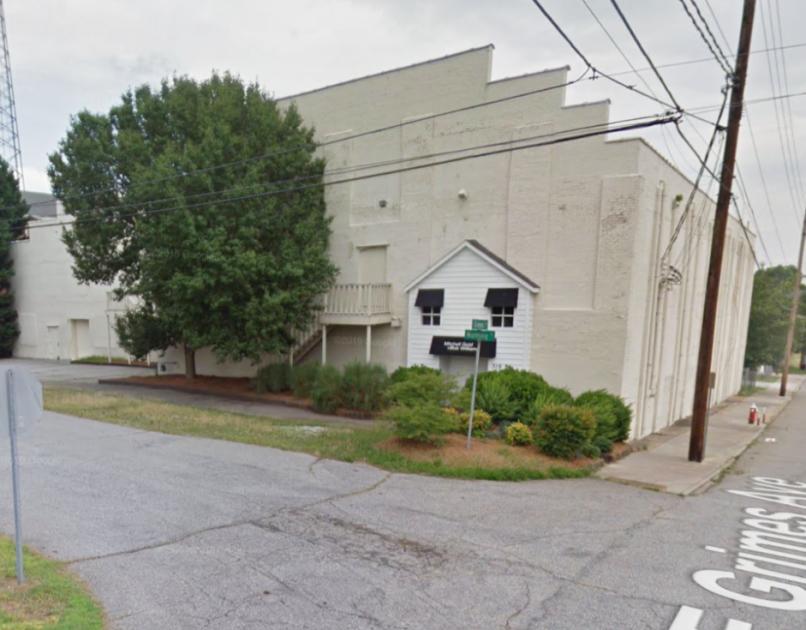
319 East Grimes Avenue High Point, NC 27260
319 East Grimes Avenue High Point, NC 27260
Details & Description
Listing Agents

Jordan Reece
O: 336-689-7545
jordan@commercialrealtync.com
O: 336-689-7545
jordan@commercialrealtync.com
While we strive to provide the most accurate information, all listing information, and demographic data, is provided by third-parties. As such, MyEListing will not be responsible for the accuracy of the information. It is strongly recommended that you verify all information with the listing agent, and any relevant agencies, prior to making any decisions.