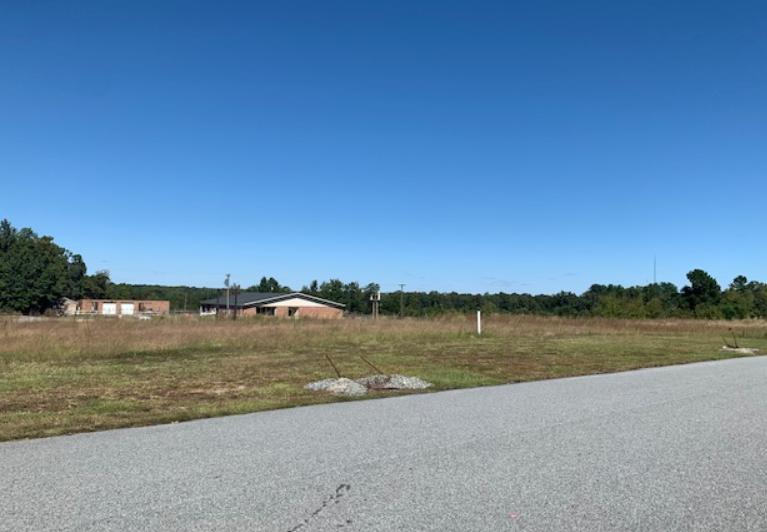
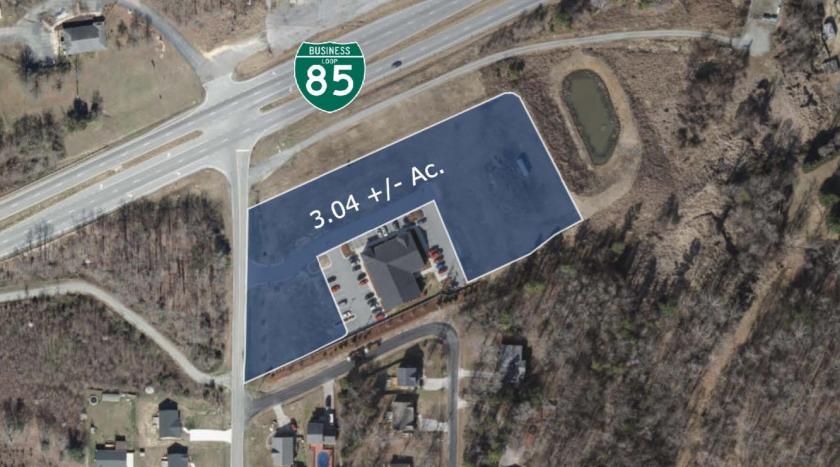
1-Mile | 3-Miles | 5-Miles | ||
---|---|---|---|---|
Total Population | 2,305 | 20,741 | 42,350 | |
Population Median Age | 40 | 39 | 41 | |
Population by Age | 0-9 Yrs | 368 (15%) | 2944 (14%) | 5475 (12%) |
10-19 Yrs | 211 (9%) | 2318 (11%) | 4728 (11%) | |
20-29 Yrs | 213 (9%) | 2531 (12%) | 4995 (11%) | |
30-39 Yrs | 390 (16%) | 2750 (13%) | 5062 (11%) | |
40-49 Yrs | 318 (13%) | 2513 (12%) | 5303 (12%) | |
50-59 Yrs | 252 (10%) | 2910 (14%) | 6726 (15%) | |
60-69 Yrs | 254 (11%) | 2305 (11%) | 4814 (11%) | |
70+ Yrs | 301 (13%) | 2472 (11%) | 5248 (12%) | |
Median HH Income | $45,738 | $42,394 | $44,603 | |
Total Household Income | < 24K | 286 (28%) | 2284 (26%) | 4499 (25%) |
25-49K | 261 (25%) | 2704 (31%) | 5017 (28%) | |
50-74K | 240 (23%) | 1903 (22%) | 3457 (19%) | |
75-99K | 135 (13%) | 884 (10%) | 2219 (12%) | |
100-199K | 75 (7%) | 768 (8%) | 2151 (12%) | |
200K+ | 16 (1%) | 96 (1%) | 266 (1%) | |
Highest Education Level | No Diploma | 287 | 3123 | 5473 |
Diploma or GED | 557 | 4797 | 9675 | |
Some College | 508 | 3113 | 6603 | |
Assoc. Degree | 99 | 1176 | 2958 | |
Bachelors Degree | 189 | 1619 | 3847 | |
Higher Degree | 42 | 494 | 1185 | |
Total Housing Units | 1,180 | 9,720 | 19,208 | |
--Owner-Occupied | 548 | 4,769 | 11,248 | |
--Renter-Occupied | 465 | 3,870 | 6,361 | |
Owner-Occupied Values | < 100K | 189 | 1766 | 3311 |
100-199K | 327 | 2424 | 5647 | |
200-299K | 28 | 396 | 1516 | |
300-399K | 3 | 112 | 478 | |
400-499K | 0 | 10 | 89 | |
500K+ | 2 | 60 | 207 | |
Total Working Age Population | 1,780 | 16,422 | 34,067 | |
In Work Force | 1,077 | 9,812 | 20,387 | |
Not In Work Force | 703 | 6,609 | 13,680 | |
Workforce Employed | 1,008 | 9,211 | 19,151 | |
Workforce Unemployed | 69 | 596 | 1,187 | |
Civlian Workforce | 1,077 | 9,807 | 20,338 | |
Military Workforce | 0 | 6 | 49 | |
Total Households | 1,013 | 8,640 | 17,609 | |
Family Households | 568 | 5,266 | 11,528 | |
Non-Family Households | 445 | 3,373 | 6,081 | |
Married Couple | 460 | 3,474 | 8,151 | |
Other Family | 108 | 1,792 | 3,377 | |
Married w/Child | 254 | 1,452 | 2,964 | |
Single Male w/Child | 14 | 283 | 481 | |
Single Female w/Child | 34 | 619 | 1,236 |
Population Change Last Two Decades - Plus Projection
2000 | % | 2010 | % | 2020 | % | 2030 | |
---|---|---|---|---|---|---|---|
North Carolina | 8,049,313 | +18 | 9,535,483 | +11 | 10,630,691 | +11 | 11,836,070 |
Davidson County | 147,246 | +11 | 162,878 | +5 | 170,888 | +8 | 184,987 |
Guilford County | 421,048 | +16 | 488,406 | +12 | 545,348 | +13 | 615,227 |
Randolph County | 130,454 | +9 | 141,752 | +3 | 145,807 | +6 | 154,739 |
Rowan County | 130,340 | +6 | 138,428 | +3 | 143,259 | +5 | 149,784 |
Total Working Age Population:
Total Households:
Total Working Age Population:
Total Households:
Total Working Age Population:
Total Households: