Retail Space
1211 Northeast Martin Luther King Junior Boulevard Portland, OR 97232
1211 Northeast Martin Luther King Junior Boulevard Portland, OR 97232
Details & Description
Property Highlights
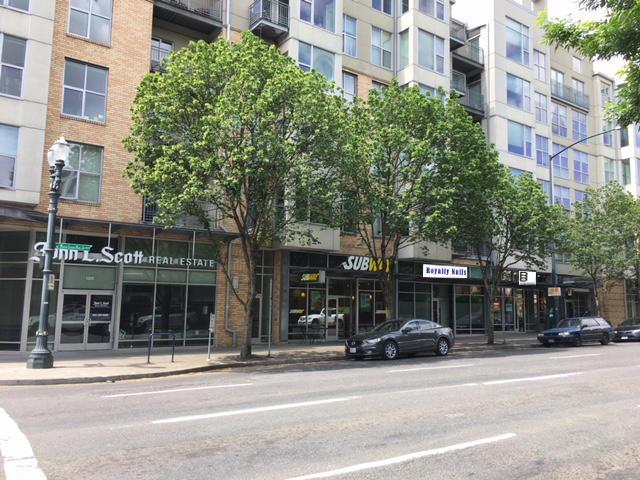
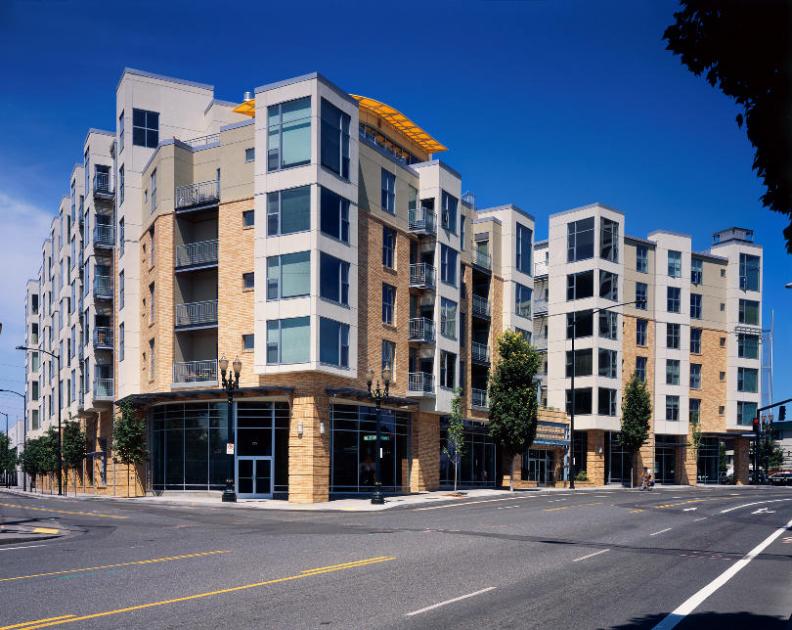
• The Merrick is a six-story mixed-use building with 185 market rate apartments above ground floor retail.
• Conveniently located on Hwy 99ENE MLK Jr Blvd along the Portland Streetcar Line.
Listing Agents

Rob Kimmelman
O: 503-595-7572
M: 503-449-2591
rob@cra-nw.com
O: 503-595-7572
M: 503-449-2591
rob@cra-nw.com
While we strive to provide the most accurate information, all listing information, and demographic data, is provided by third-parties. As such, MyEListing will not be responsible for the accuracy of the information. It is strongly recommended that you verify all information with the listing agent, and any relevant agencies, prior to making any decisions.