Retail Space
13648 Orchard Parkway Westminster, CO 80023
13648 Orchard Parkway Westminster, CO 80023
Details & Description
Property Highlights
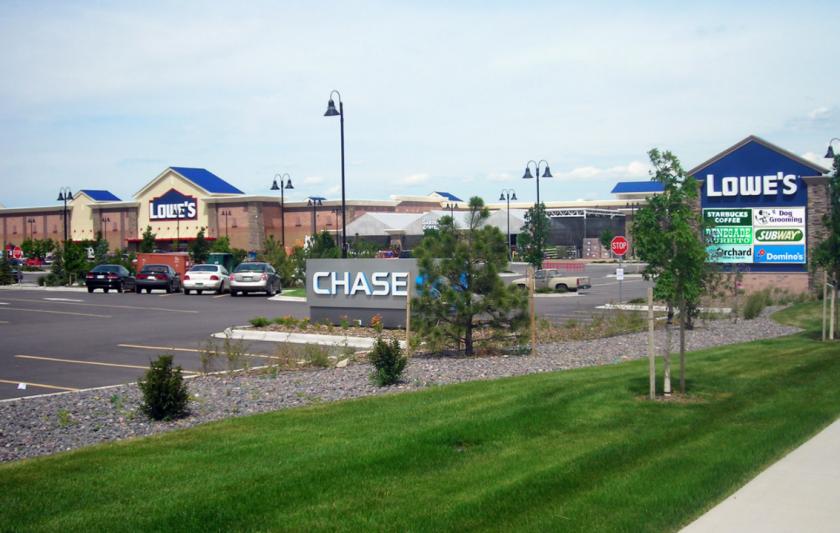
• Minutes from Orchard Town Center, Denver Premium Outlets, St. Anthony Hospital Campus, and more
• Join Lowes, Starbucks, Chase, Dominos, Subway, and more within the center
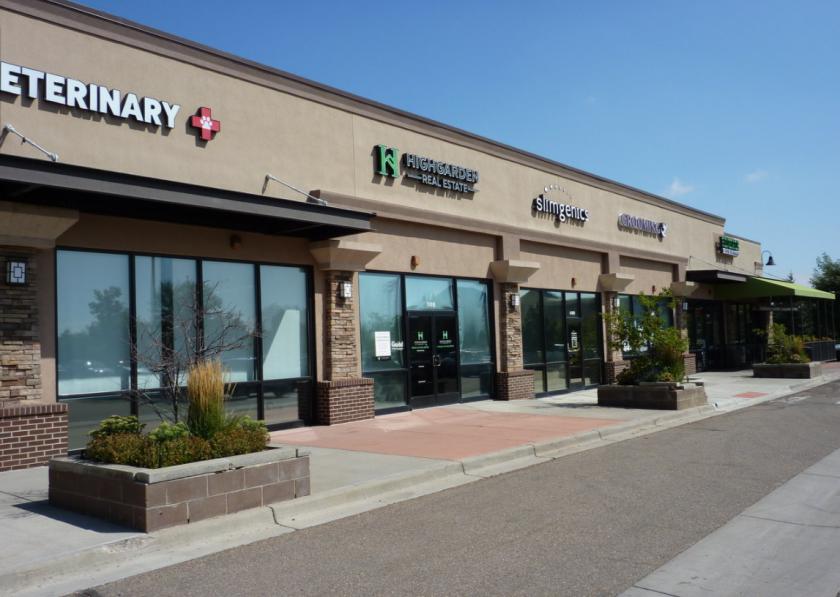
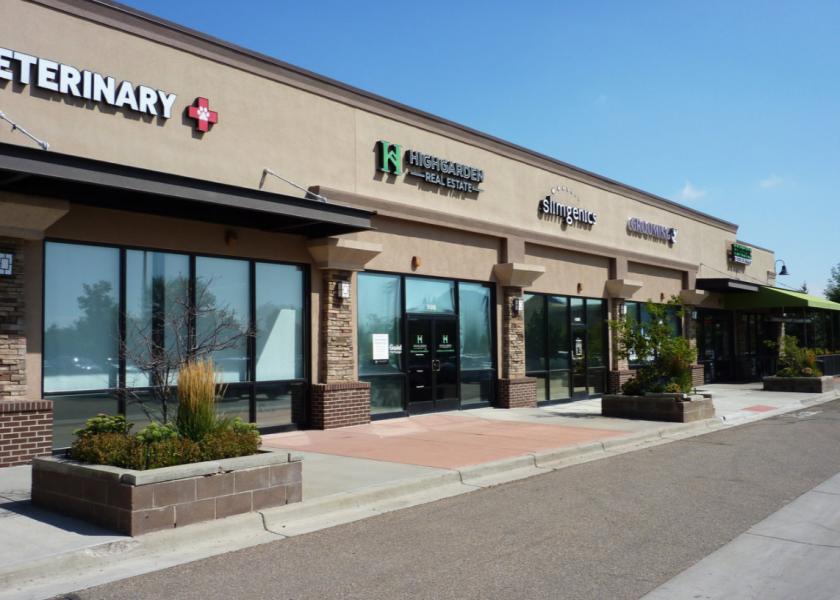
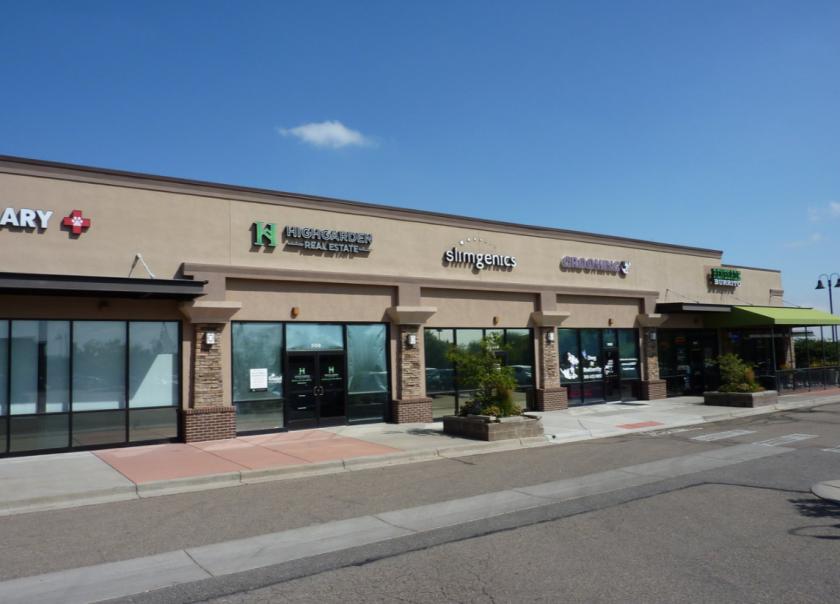
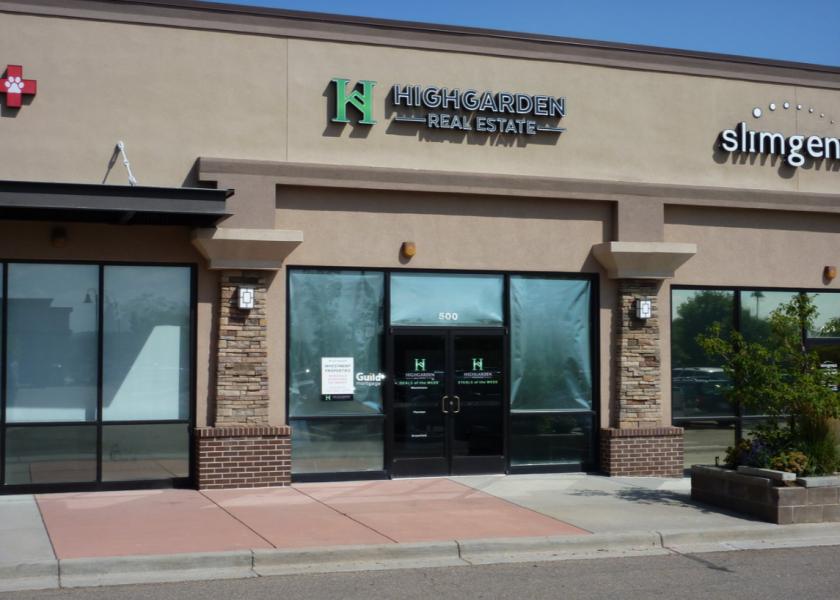
Additional Photos
Listing Agents

Brian Frank
O: 303-592-7300
bfrank@axiore.com
O: 303-592-7300
bfrank@axiore.com
While we strive to provide the most accurate information, all listing information, and demographic data, is provided by third-parties. As such, MyEListing will not be responsible for the accuracy of the information. It is strongly recommended that you verify all information with the listing agent, and any relevant agencies, prior to making any decisions.


