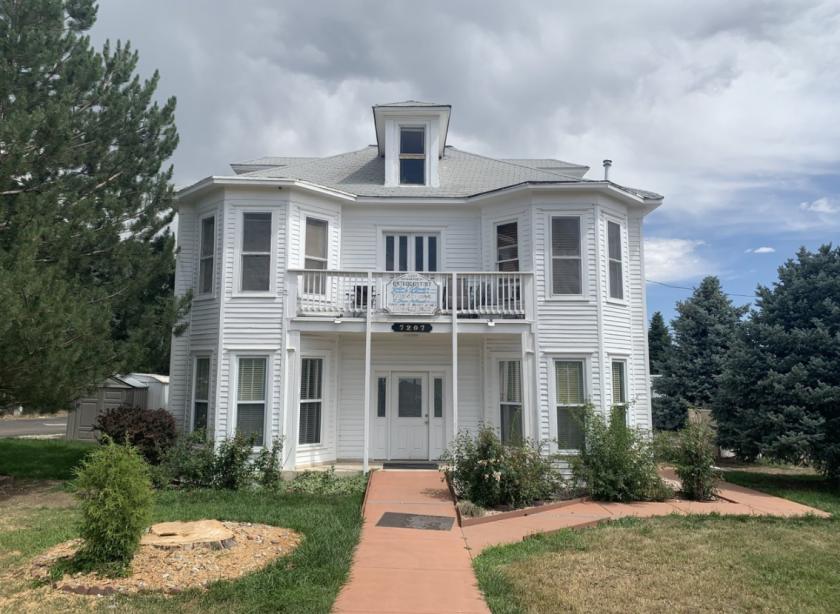
Retail Space
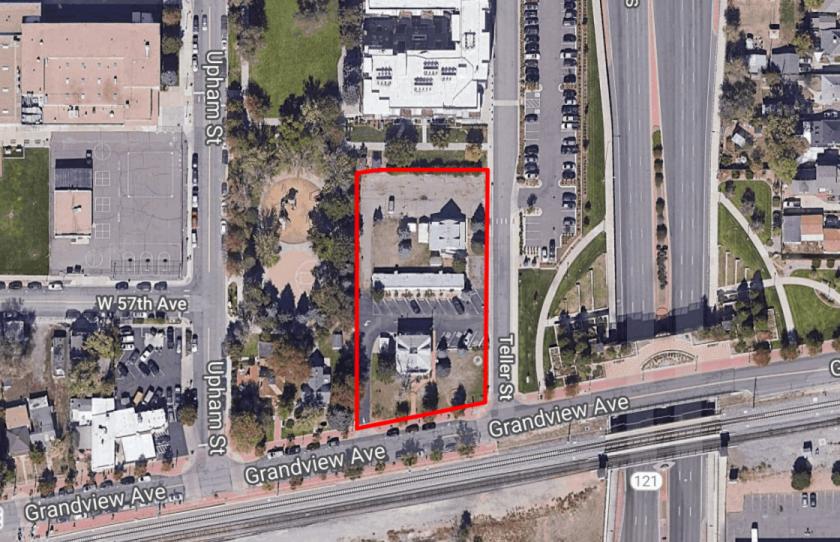
7207 Grandview Avenue Arvada, CO 80002
7207 Grandview Avenue Arvada, CO 80002
Details & Description
Property Highlights
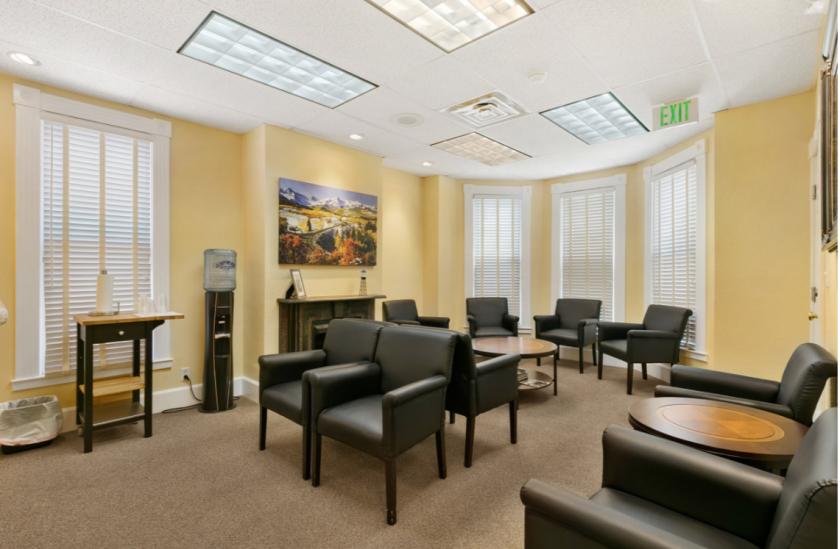
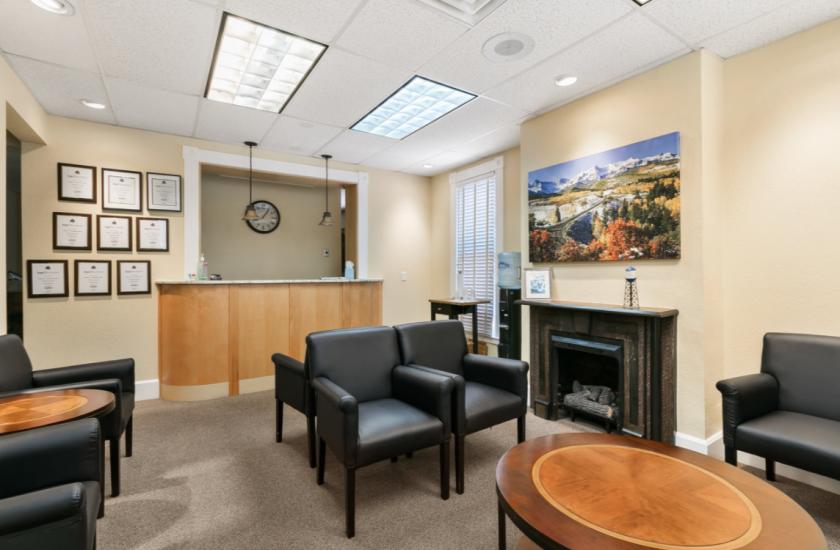
- • Turnkey Dental Space or RetailOffice Space
- • Mixed Use Property in Historic Building
- • Basement Storage at No Extra Rent
- • 2 Bathrooms on 1st Floor, One ADA
Additional Photos

Listing Agents

John Livaditis
O: 303-592-7300
john@axiore.com
O: 303-592-7300
john@axiore.com
While we strive to provide the most accurate information, all listing information, and demographic data, is provided by third-parties. As such, MyEListing will not be responsible for the accuracy of the information. It is strongly recommended that you verify all information with the listing agent, and any relevant agencies, prior to making any decisions.


