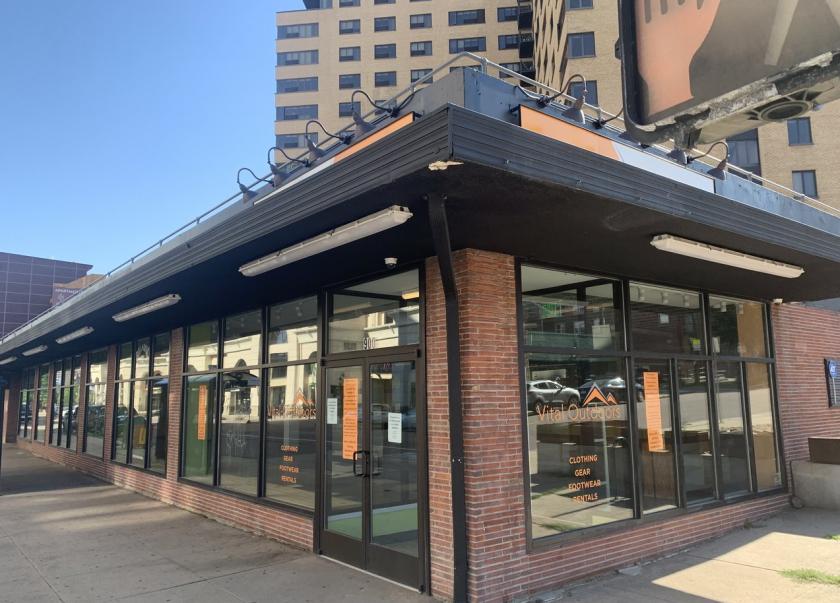
Retail Space
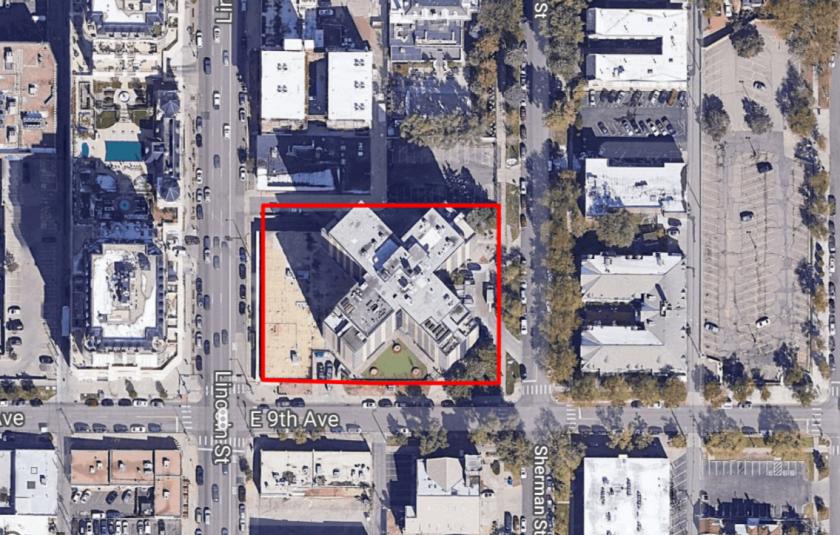
901 Sherman Street Denver, CO 80203
901 Sherman Street Denver, CO 80203
Details & Description
Property Highlights
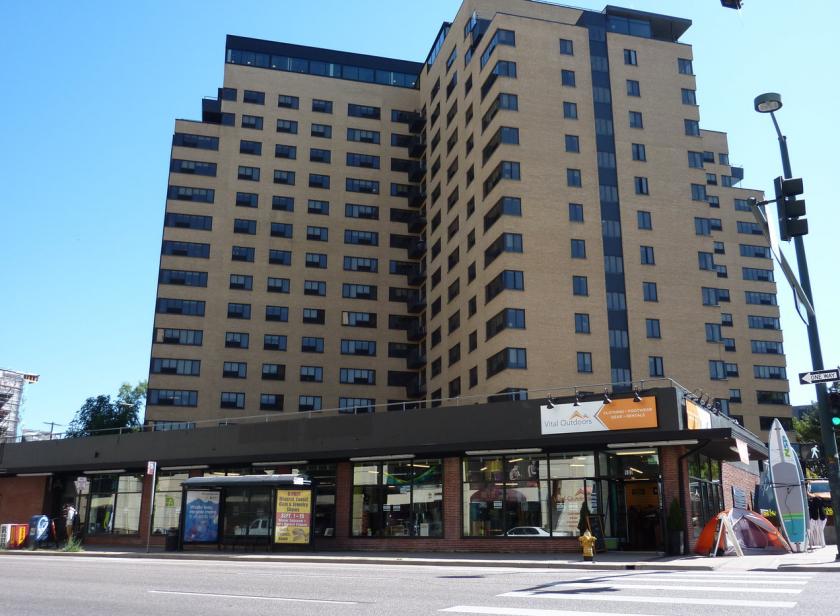
- • Golden Triangle Location, Blocks from Downtown
- • High Traffic Location with Great Visibility
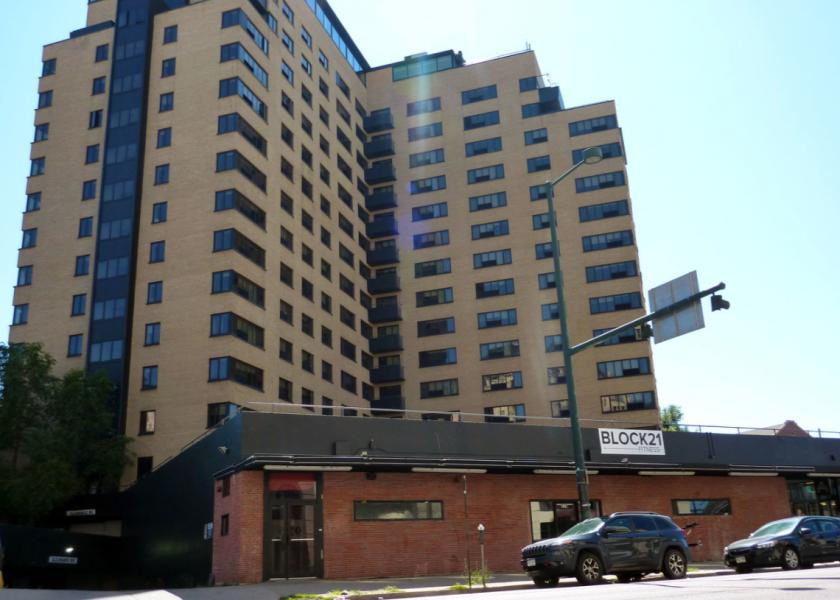
- • Densely Populated Residential Neighborhood
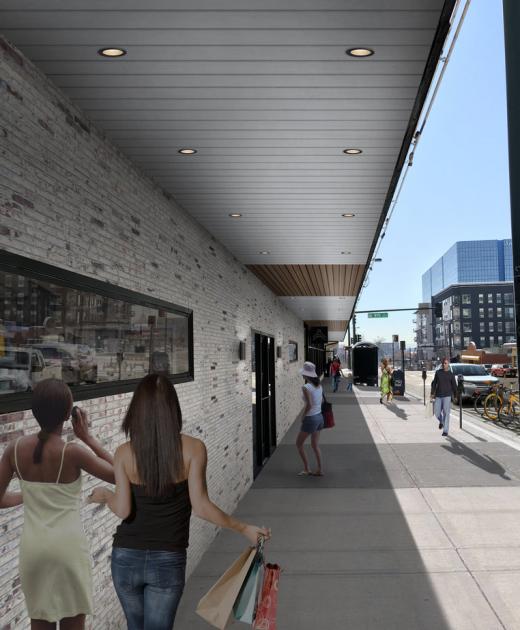
Additional Photos
Listing Agents

John Livaditis
O: 303-592-7300
john@axiore.com
O: 303-592-7300
john@axiore.com
While we strive to provide the most accurate information, all listing information, and demographic data, is provided by third-parties. As such, MyEListing will not be responsible for the accuracy of the information. It is strongly recommended that you verify all information with the listing agent, and any relevant agencies, prior to making any decisions.


