Office Space
1060 Bannock Street Denver, CO 80204
1060 Bannock Street Denver, CO 80204
Details & Description
Property Highlights
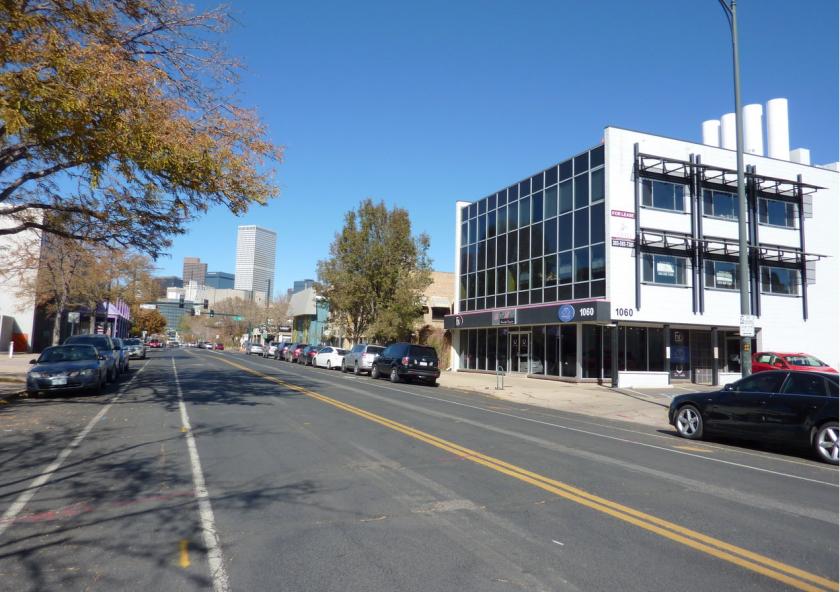
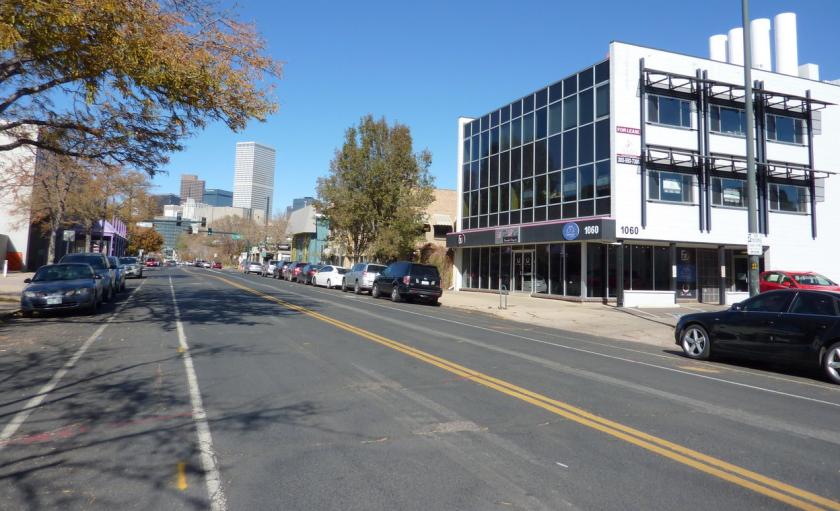
- • Redeveloped, Well Maintained 3 Story Building
- • Located Within Minutes of Downtown Denver
- • ADA Accessible
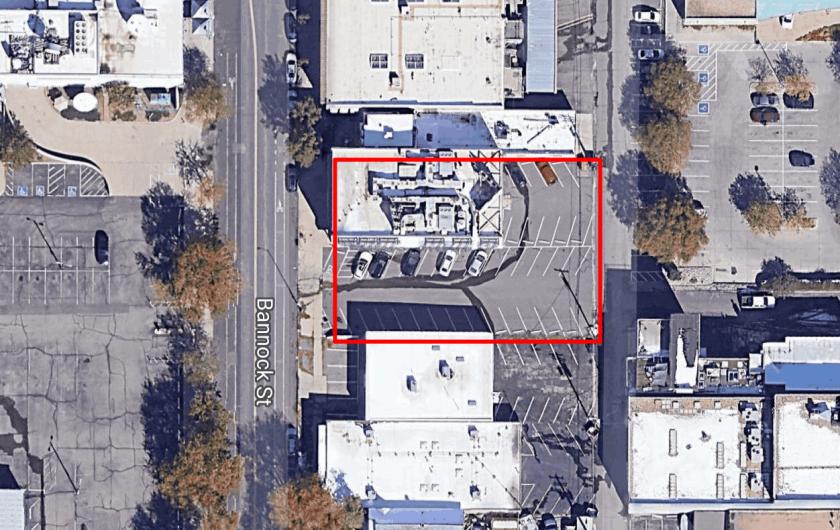
- • Off-Street Parking Available
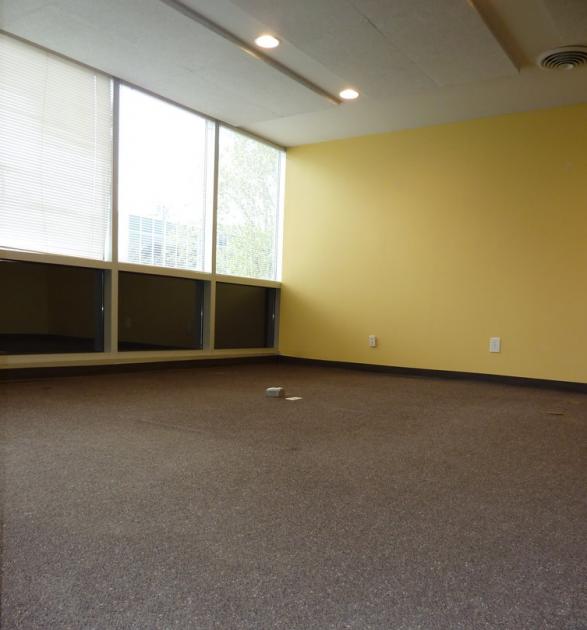
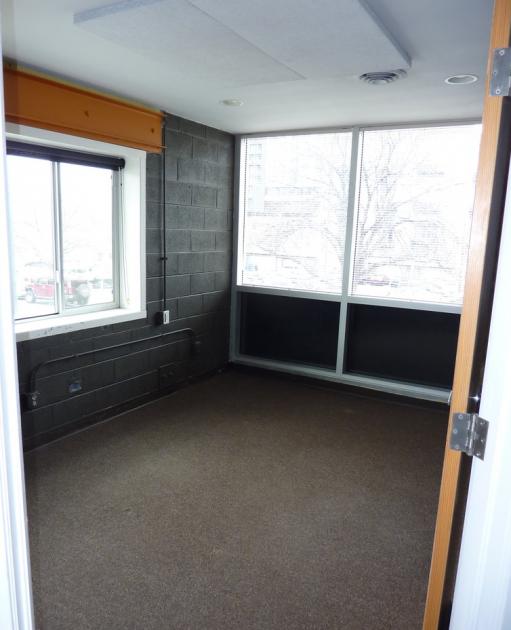
Additional Photos
Listing Agents

John Livaditis
O: 303-592-7300
john@axiore.com
O: 303-592-7300
john@axiore.com
While we strive to provide the most accurate information, all listing information, and demographic data, is provided by third-parties. As such, MyEListing will not be responsible for the accuracy of the information. It is strongly recommended that you verify all information with the listing agent, and any relevant agencies, prior to making any decisions.


