Retail Space
425 Southwest Montgomery Street Portland, OR 97201
425 Southwest Montgomery Street Portland, OR 97201
Details & Description
Property Highlights
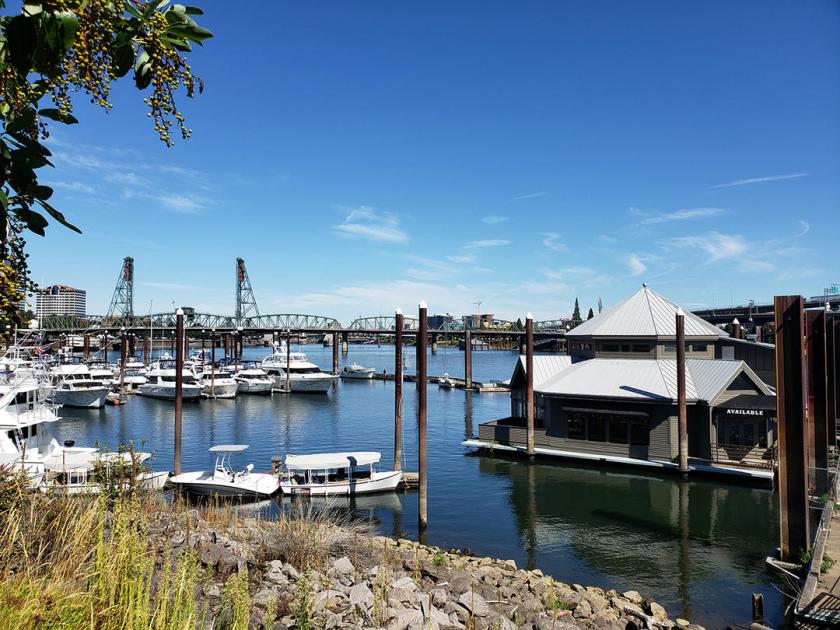
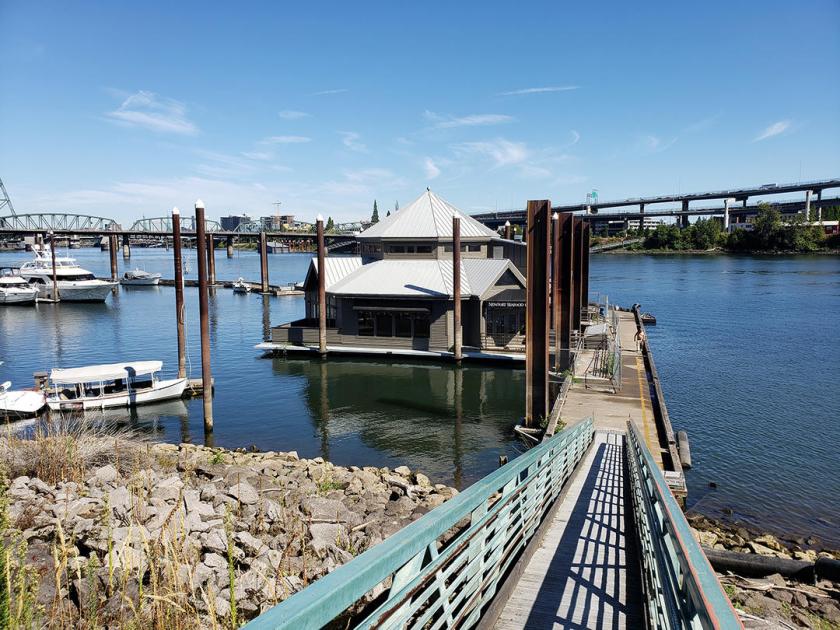
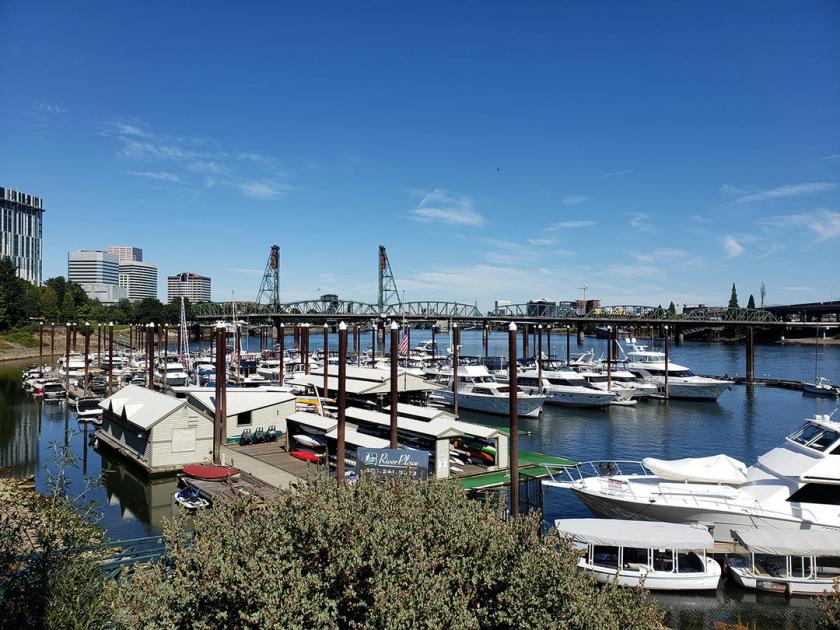
• Rare opportunity for 2nd generation floating restaurant on the Willamette River in downtown Portland
• Accessible to river traffic boat docking available adjacent to restaurant.
Additional Photos

Listing Agents

Kathleen Healy
O: 503-595-7558
M: 503-880-3033
kathleen@cra-nw.com
O: 503-595-7558
M: 503-880-3033
kathleen@cra-nw.com

Ashley Heichelbech
O: 503-595-7577
M: 503-490-7212
ashley@cra-nw.com
O: 503-595-7577
M: 503-490-7212
ashley@cra-nw.com
While we strive to provide the most accurate information, all listing information, and demographic data, is provided by third-parties. As such, MyEListing will not be responsible for the accuracy of the information. It is strongly recommended that you verify all information with the listing agent, and any relevant agencies, prior to making any decisions.


