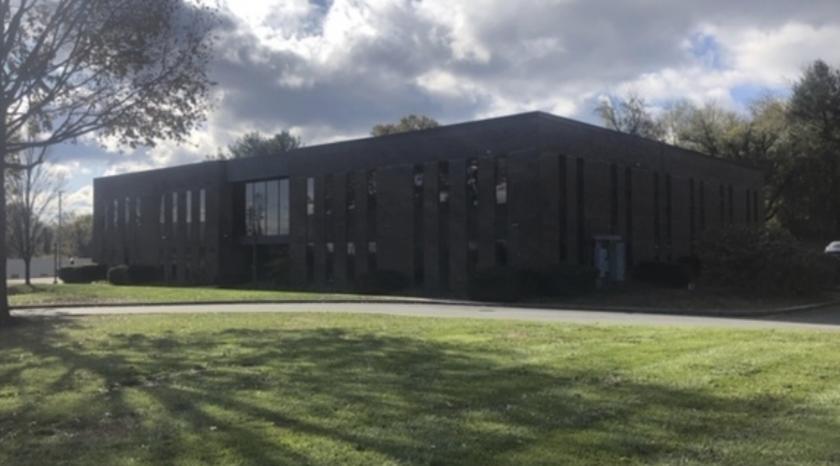
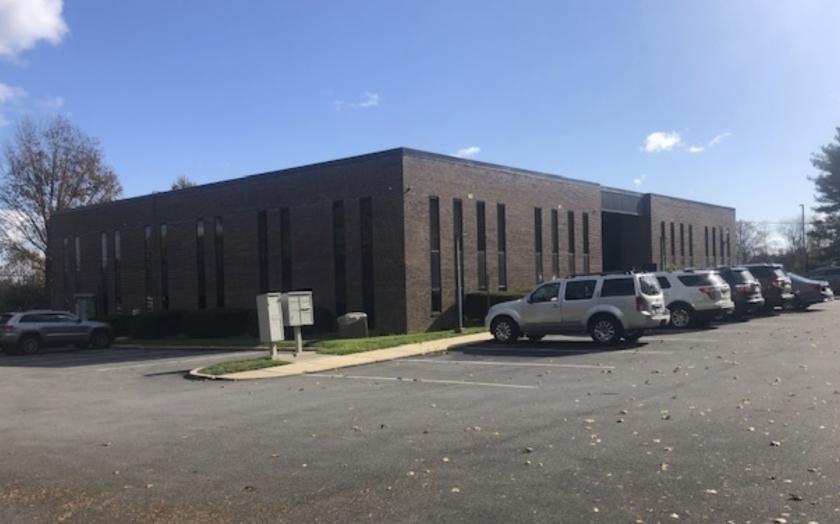
1-Mile | 3-Miles | 5-Miles | ||
---|---|---|---|---|
Total Population | 2,213 | 22,476 | 94,939 | |
Population Median Age | 41 | 41 | 39 | |
Population by Age | 0-9 Yrs | 235 (10%) | 2553 (11%) | 8865 (9%) |
10-19 Yrs | 356 (16%) | 3095 (13%) | 14031 (14%) | |
20-29 Yrs | 178 (8%) | 2356 (10%) | 16343 (17%) | |
30-39 Yrs | 202 (9%) | 2363 (10%) | 10558 (11%) | |
40-49 Yrs | 318 (14%) | 2873 (12%) | 11346 (11%) | |
50-59 Yrs | 369 (16%) | 3711 (16%) | 12422 (13%) | |
60-69 Yrs | 363 (16%) | 2992 (13%) | 10589 (11%) | |
70+ Yrs | 191 (8%) | 2532 (11%) | 10784 (11%) | |
Median HH Income | $162,184 | $138,354 | $99,980 | |
Total Household Income | < 24K | 36 (4%) | 449 (5%) | 4070 (11%) |
25-49K | 62 (7%) | 732 (9%) | 4832 (14%) | |
50-74K | 63 (8%) | 674 (8%) | 4222 (12%) | |
75-99K | 86 (10%) | 923 (12%) | 4044 (11%) | |
100-199K | 219 (27%) | 2320 (30%) | 9773 (28%) | |
200K+ | 321 (40%) | 2570 (33%) | 7388 (21%) | |
Highest Education Level | No Diploma | 23 | 538 | 2768 |
Diploma or GED | 169 | 2572 | 11574 | |
Some College | 148 | 1530 | 7536 | |
Assoc. Degree | 100 | 904 | 3417 | |
Bachelors Degree | 561 | 5413 | 20493 | |
Higher Degree | 546 | 4647 | 15903 | |
Total Housing Units | 802 | 7,848 | 35,849 | |
--Owner-Occupied | 702 | 6,368 | 22,722 | |
--Renter-Occupied | 85 | 1,301 | 11,607 | |
Owner-Occupied Values | < 100K | 7 | 62 | 517 |
100-199K | 45 | 216 | 1541 | |
200-299K | 6 | 489 | 2779 | |
300-399K | 92 | 867 | 4282 | |
400-499K | 147 | 1439 | 4948 | |
500K+ | 404 | 3294 | 8655 | |
Total Working Age Population | 1,766 | 18,139 | 79,934 | |
In Work Force | 1,186 | 11,528 | 50,729 | |
Not In Work Force | 579 | 6,611 | 29,205 | |
Workforce Employed | 1,153 | 11,188 | 48,652 | |
Workforce Unemployed | 33 | 340 | 2,075 | |
Civlian Workforce | 1,186 | 11,528 | 50,727 | |
Military Workforce | 0 | 0 | 2 | |
Total Households | 787 | 7,669 | 34,328 | |
Family Households | 650 | 6,086 | 21,713 | |
Non-Family Households | 137 | 1,583 | 12,615 | |
Married Couple | 577 | 5,465 | 18,490 | |
Other Family | 73 | 621 | 3,224 | |
Married w/Child | 262 | 2,255 | 7,467 | |
Single Male w/Child | 5 | 68 | 452 | |
Single Female w/Child | 21 | 205 | 1,048 |
Population Change Last Two Decades - Plus Projection
2000 | % | 2010 | % | 2020 | % | 2030 | |
---|---|---|---|---|---|---|---|
Delaware | 783,600 | +15 | 897,934 | +10 | 989,803 | +6 | 1,044,965 |
New Castle County | 500,265 | +8 | 538,479 | +6 | 571,165 | +4 | 596,221 |
Pennsylvania | 12,281,054 | +3 | 12,702,379 | +4 | 13,230,170 | +4 | 13,759,594 |
Chester County | 433,501 | +15 | 498,886 | +7 | 533,837 | +7 | 573,576 |
Delaware County | 550,864 | +1 | 558,979 | +5 | 588,436 | +6 | 622,307 |
Total Working Age Population:
Total Households:
Total Working Age Population:
Total Households:
Total Working Age Population:
Total Households: