Commercial Land
NE Andresen Rd and NE Vancouver Mall Dr Vancouver, WA 98661
NE Andresen Rd and NE Vancouver Mall Dr Vancouver, WA 98661

Details & Description
Property Highlights
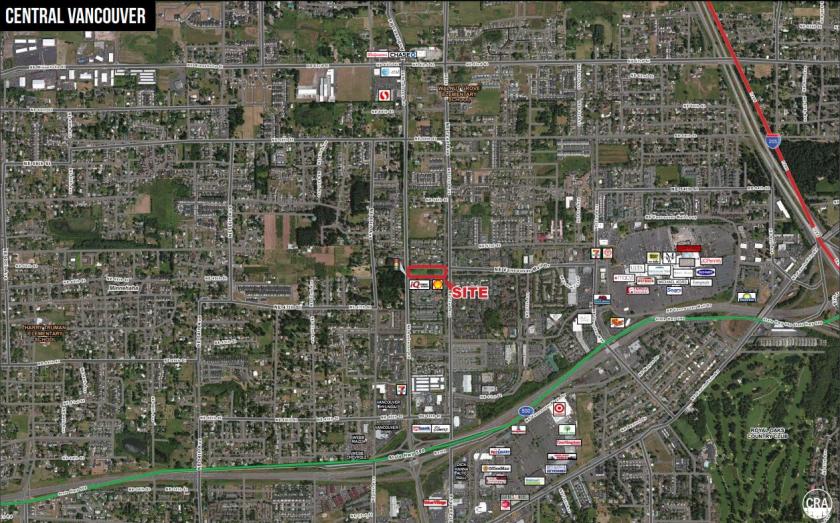
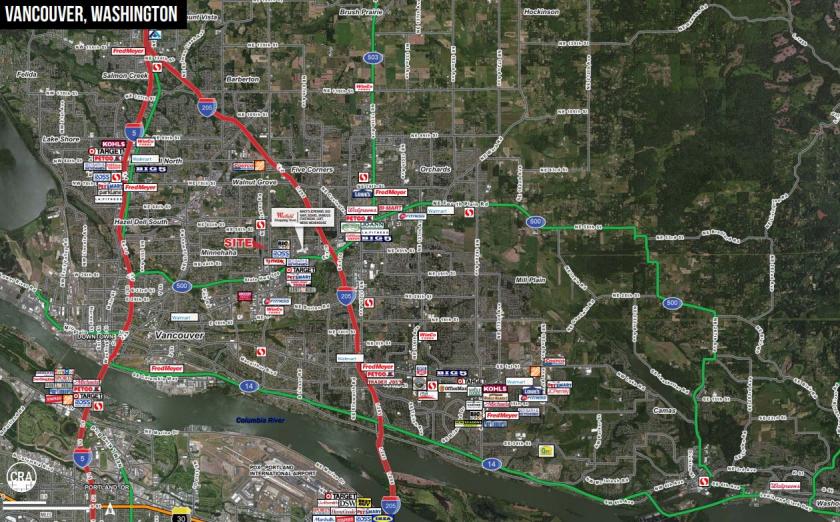
• Other major retailers in the trade area include Target, Walmart, WinCo and 24 Hour Fitness.
• Near Westfield Vancouver Mall, anchored by Macys, Cinetopia, JCPenney and Old Navy.
Listing Agents

Jeff Olson
O: 503-595-7567
M: 503-957-1452
jeff@cra-nw.com
O: 503-595-7567
M: 503-957-1452
jeff@cra-nw.com

Kelli Maks
CRA Northwest LLC
O: 503-595-7565
M: 503-680-3765
kelli@cra-nw.com
CRA Northwest LLC
O: 503-595-7565
M: 503-680-3765
kelli@cra-nw.com
While we strive to provide the most accurate information, all listing information, and demographic data, is provided by third-parties. As such, MyEListing will not be responsible for the accuracy of the information. It is strongly recommended that you verify all information with the listing agent, and any relevant agencies, prior to making any decisions.