Industrial Properties
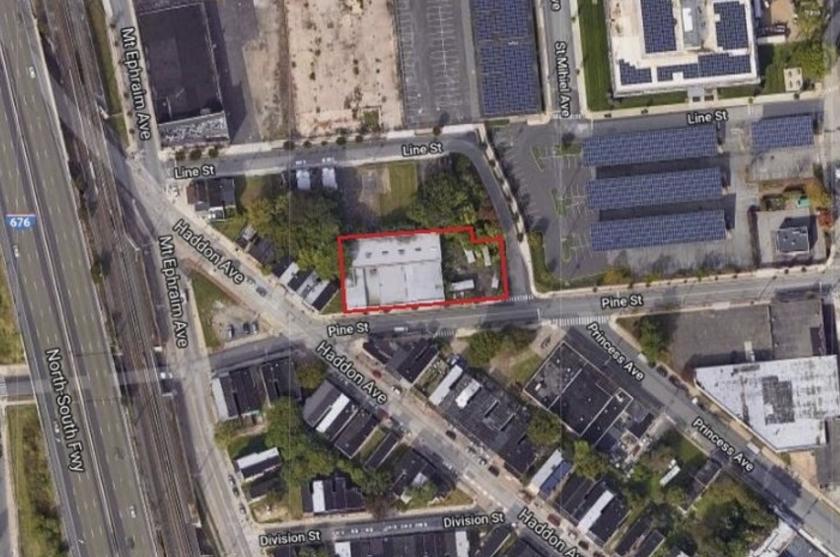
1021 Pine Street Camden, NJ 08103
1021 Pine Street Camden, NJ 08103
Details & Description
Property Highlights
- • Zoning OLI Office Light Industrial
- • Construction Wood and Masonry
- • Electric PSEG
- • Sewer City of Camden
- • Parking 10 free Surface Spaces are available
- • Benefits Qualified Opportunity Zone
Listing Agents

Michael Torsiello
O: 215-448-6000
mtorsiello@binswanger.com
O: 215-448-6000
mtorsiello@binswanger.com
While we strive to provide the most accurate information, all listing information, and demographic data, is provided by third-parties. As such, MyEListing will not be responsible for the accuracy of the information. It is strongly recommended that you verify all information with the listing agent, and any relevant agencies, prior to making any decisions.


