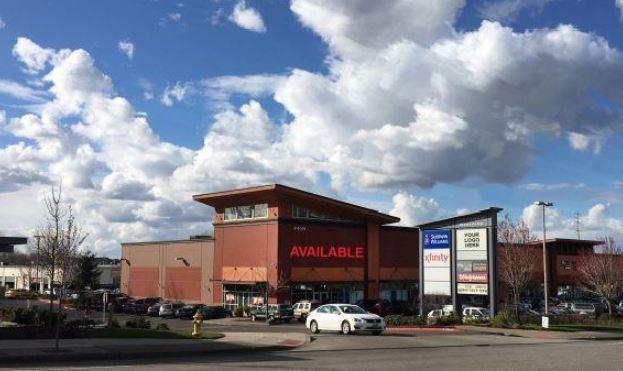
Retail Space
439 Northeast 223rd Avenue Gresham, OR 97030
439 Northeast 223rd Avenue Gresham, OR 97030
Details & Description
Property Highlights
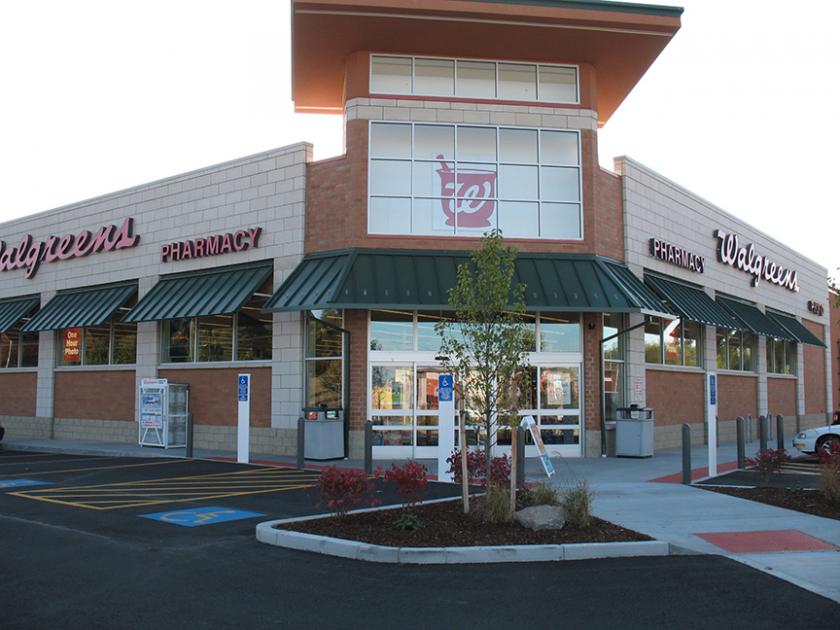
• Co-tenants include Walgreens, Pacific Dental, Legacy GoHealth, Sherwin Williams, Subway and Comcast XFinity.
• Co-tenants include Walgreens, Pacific Dental, Legacy GoHealth, Sherwin Williams, Subway and Comcast XFinity.
Listing Agents

Jeff Olson
O: 503-595-7567
M: 503-957-1452
jeff@cra-nw.com
O: 503-595-7567
M: 503-957-1452
jeff@cra-nw.com

Kelli Maks
CRA Northwest LLC
O: 503-595-7565
M: 503-680-3765
kelli@cra-nw.com
CRA Northwest LLC
O: 503-595-7565
M: 503-680-3765
kelli@cra-nw.com
While we strive to provide the most accurate information, all listing information, and demographic data, is provided by third-parties. As such, MyEListing will not be responsible for the accuracy of the information. It is strongly recommended that you verify all information with the listing agent, and any relevant agencies, prior to making any decisions.