Retail Space
10565 Southwest Beaverton Hillsdale Highway Beaverton, OR 97005
10565 Southwest Beaverton Hillsdale Highway Beaverton, OR 97005
Details & Description
Property Highlights
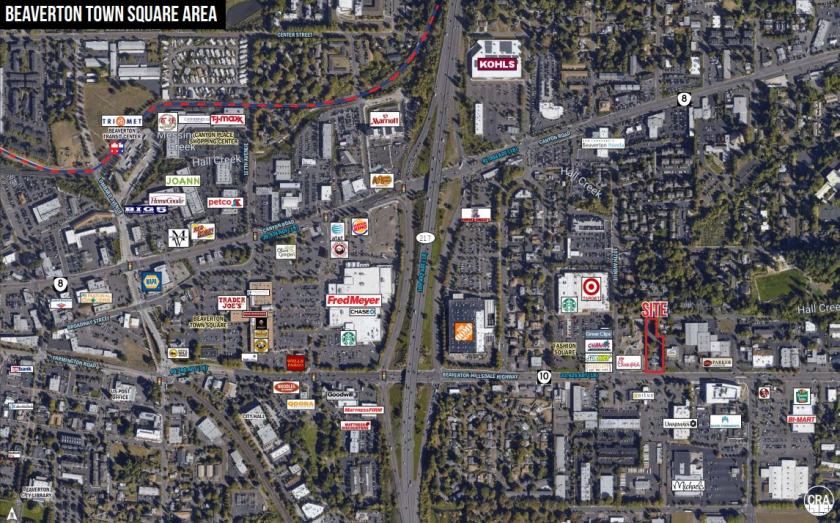
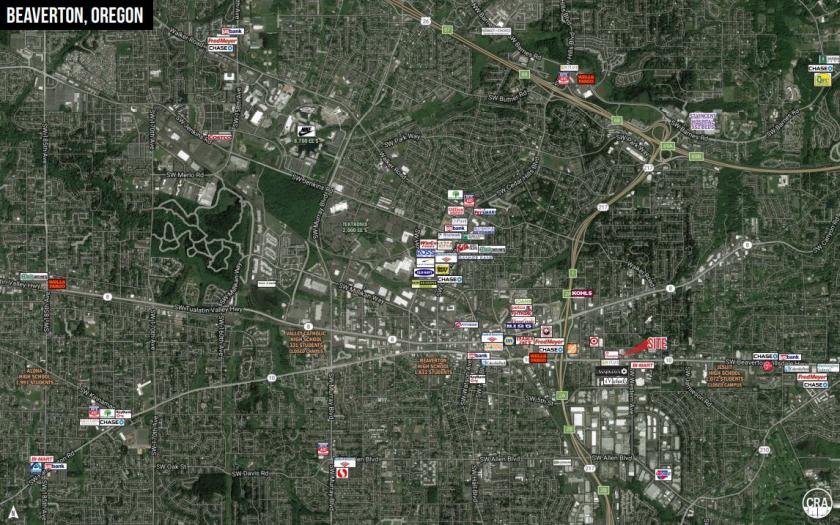
• Retailers in the trade area include Target, Home Depot, Kohls, Fred Meyer and Trader Joes.
• Freestanding restaurant building with drive-thru available for lease.
Listing Agents

Jeff Olson
O: 503-595-7567
M: 503-957-1452
jeff@cra-nw.com
O: 503-595-7567
M: 503-957-1452
jeff@cra-nw.com

Kelli Maks
CRA Northwest LLC
O: 503-595-7565
M: 503-680-3765
kelli@cra-nw.com
CRA Northwest LLC
O: 503-595-7565
M: 503-680-3765
kelli@cra-nw.com
While we strive to provide the most accurate information, all listing information, and demographic data, is provided by third-parties. As such, MyEListing will not be responsible for the accuracy of the information. It is strongly recommended that you verify all information with the listing agent, and any relevant agencies, prior to making any decisions.