Commercial Land
11929 Northeast Airport Way Portland, OR 97220
11929 Northeast Airport Way Portland, OR 97220
Details & Description
Property Highlights
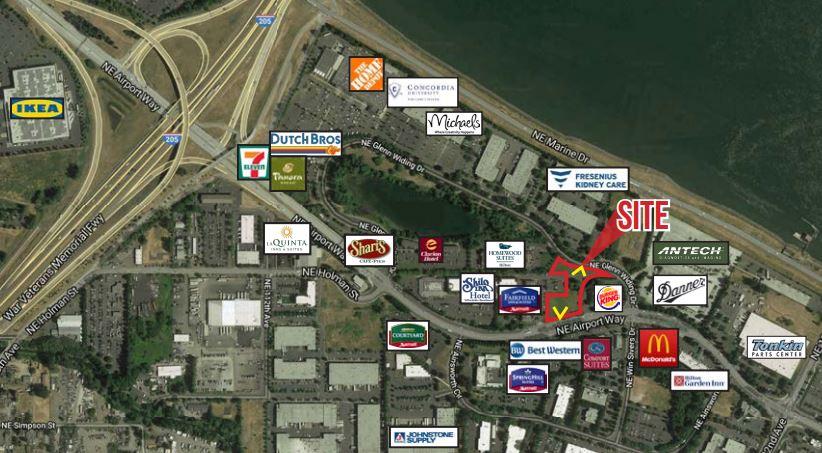
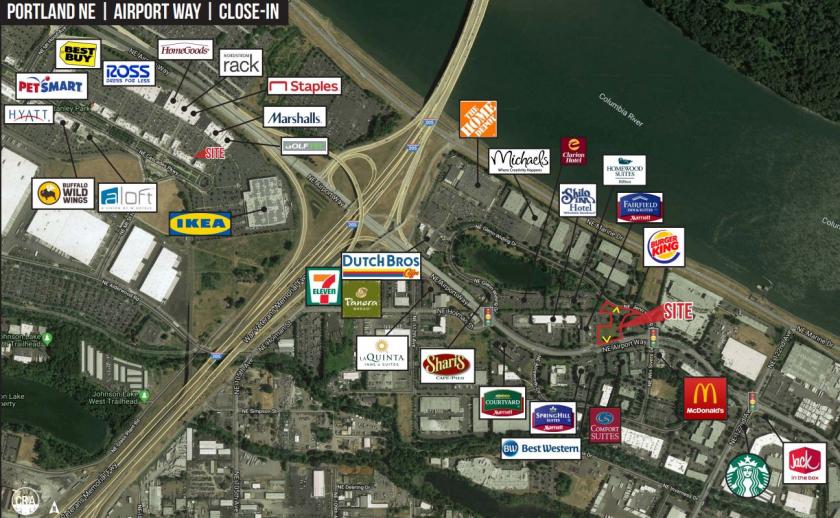
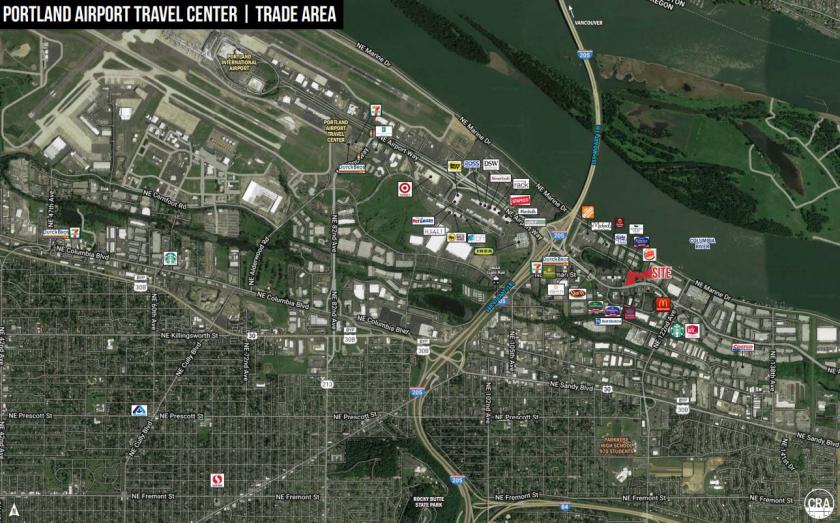
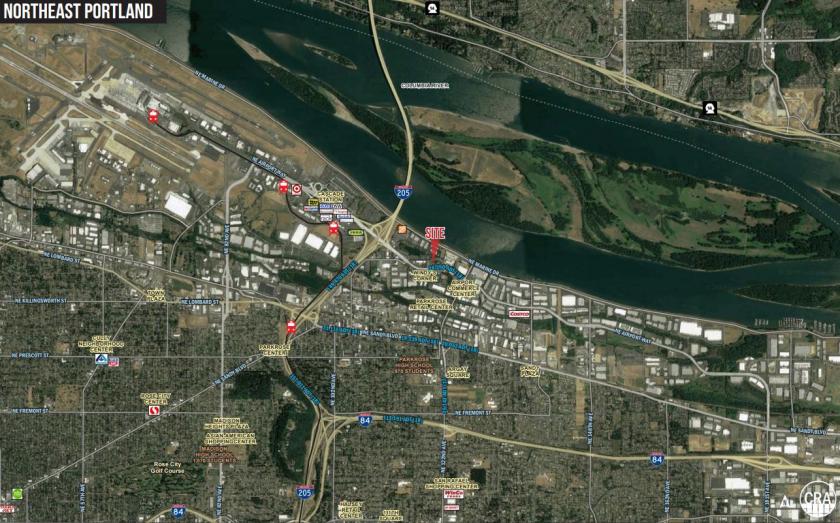
• Drive-thru retail pad site with easy access to I-205 and Marine Drive.
• Drive-thru retail pad site with easy access to I-205 and Marine Drive.
Additional Photos
Listing Agents

Jeff Olson
O: 503-595-7567
M: 503-957-1452
jeff@cra-nw.com
O: 503-595-7567
M: 503-957-1452
jeff@cra-nw.com

Kelli Maks
CRA Northwest LLC
O: 503-595-7565
M: 503-680-3765
kelli@cra-nw.com
CRA Northwest LLC
O: 503-595-7565
M: 503-680-3765
kelli@cra-nw.com
While we strive to provide the most accurate information, all listing information, and demographic data, is provided by third-parties. As such, MyEListing will not be responsible for the accuracy of the information. It is strongly recommended that you verify all information with the listing agent, and any relevant agencies, prior to making any decisions.


