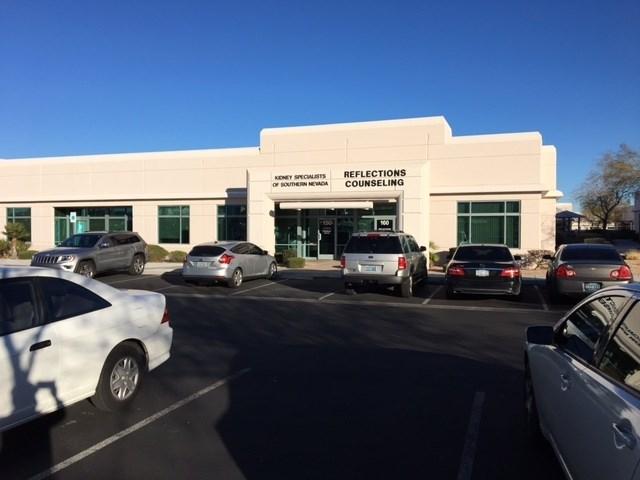
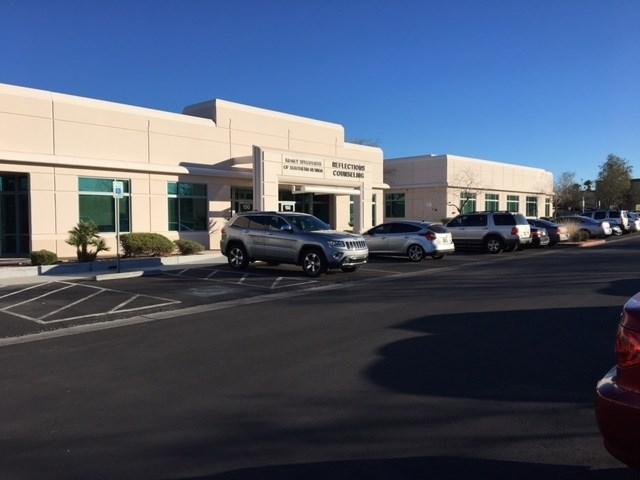
1-Mile | 3-Miles | 5-Miles | ||
---|---|---|---|---|
Total Population | 17,754 | 184,190 | 402,771 | |
Population Median Age | 37 | 39 | 40 | |
Population by Age | 0-9 Yrs | 2221 (12%) | 22544 (12%) | 46788 (11%) |
10-19 Yrs | 2018 (11%) | 22266 (12%) | 48328 (11%) | |
20-29 Yrs | 3271 (18%) | 25134 (13%) | 52217 (12%) | |
30-39 Yrs | 2903 (16%) | 23955 (13%) | 50453 (12%) | |
40-49 Yrs | 1978 (11%) | 24263 (13%) | 53459 (13%) | |
50-59 Yrs | 2266 (12%) | 24825 (13%) | 54593 (13%) | |
60-69 Yrs | 1794 (10%) | 21430 (11%) | 49049 (12%) | |
70+ Yrs | 1305 (7%) | 19773 (10%) | 47885 (11%) | |
Median HH Income | $54,146 | $55,628 | $58,586 | |
Total Household Income | < 24K | 1376 (18%) | 13728 (19%) | 28306 (18%) |
25-49K | 2030 (27%) | 17523 (25%) | 37043 (24%) | |
50-74K | 1473 (19%) | 13132 (19%) | 28416 (18%) | |
75-99K | 1055 (14%) | 9616 (13%) | 21526 (14%) | |
100-199K | 1159 (15%) | 12379 (17%) | 28813 (18%) | |
200K+ | 296 (4%) | 2590 (3%) | 7789 (5%) | |
Highest Education Level | No Diploma | 1294 | 17240 | 36681 |
Diploma or GED | 3299 | 37354 | 82307 | |
Some College | 2928 | 32351 | 71614 | |
Assoc. Degree | 1014 | 10560 | 23195 | |
Bachelors Degree | 2384 | 19919 | 45176 | |
Higher Degree | 1151 | 10055 | 24819 | |
Total Housing Units | 8,266 | 76,418 | 168,324 | |
--Owner-Occupied | 2,742 | 37,053 | 86,398 | |
--Renter-Occupied | 4,648 | 31,916 | 65,495 | |
Owner-Occupied Values | < 100K | 263 | 2755 | 5036 |
100-199K | 473 | 10781 | 22264 | |
200-299K | 817 | 12782 | 28437 | |
300-399K | 557 | 6107 | 15485 | |
400-499K | 304 | 2323 | 5965 | |
500K+ | 327 | 2304 | 9210 | |
Total Working Age Population | 14,163 | 147,958 | 326,029 | |
In Work Force | 10,153 | 94,298 | 203,096 | |
Not In Work Force | 4,010 | 53,660 | 122,933 | |
Workforce Employed | 9,548 | 87,766 | 189,559 | |
Workforce Unemployed | 586 | 6,271 | 12,946 | |
Civlian Workforce | 10,133 | 94,037 | 202,505 | |
Military Workforce | 20 | 261 | 591 | |
Total Households | 7,390 | 68,969 | 151,892 | |
Family Households | 4,126 | 42,128 | 95,242 | |
Non-Family Households | 3,264 | 26,840 | 56,650 | |
Married Couple | 2,509 | 28,068 | 65,413 | |
Other Family | 1,617 | 14,061 | 29,829 | |
Married w/Child | 894 | 10,207 | 22,707 | |
Single Male w/Child | 219 | 1,839 | 3,995 | |
Single Female w/Child | 710 | 4,843 | 10,023 |
Population Change Last Two Decades - Plus Projection
2000 | % | 2010 | % | 2020 | % | 2030 | |
---|---|---|---|---|---|---|---|
Nevada | 1,998,257 | +35 | 2,700,551 | +17 | 3,149,234 | +10 | 3,460,728 |
Clark County | 1,375,765 | +42 | 1,951,269 | +19 | 2,318,174 | +10 | 2,550,048 |
Nye County | 32,485 | +35 | 43,946 | +11 | 48,864 | +8 | 52,587 |
Total Working Age Population:
Total Households:
Total Working Age Population:
Total Households:
Total Working Age Population:
Total Households: