Retail Space
1805 Pioneer Parkway East Springfield, OR 97477
1805 Pioneer Parkway East Springfield, OR 97477
Details & Description
Property Highlights
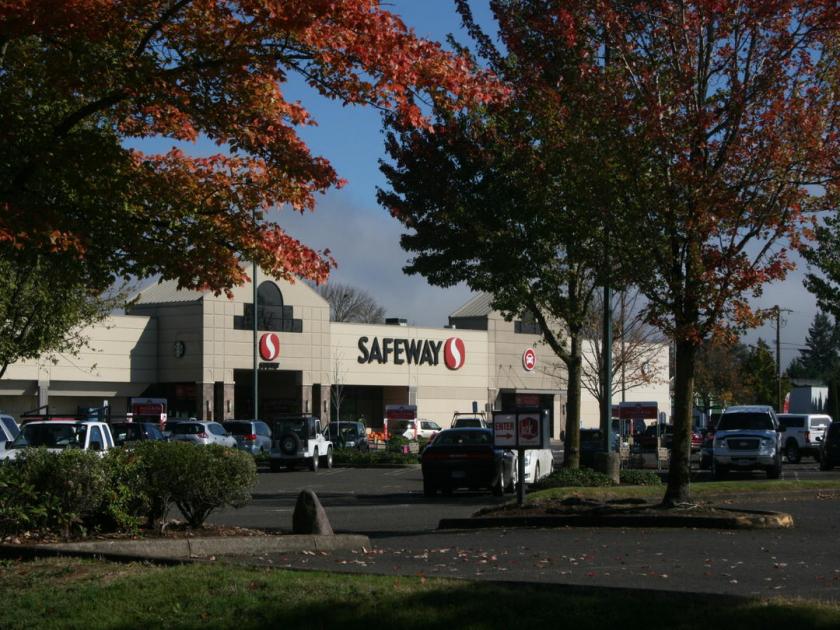
• Located on a high traffic corner with excellent visibility from Pioneer Parkway, Q Street and I-105.
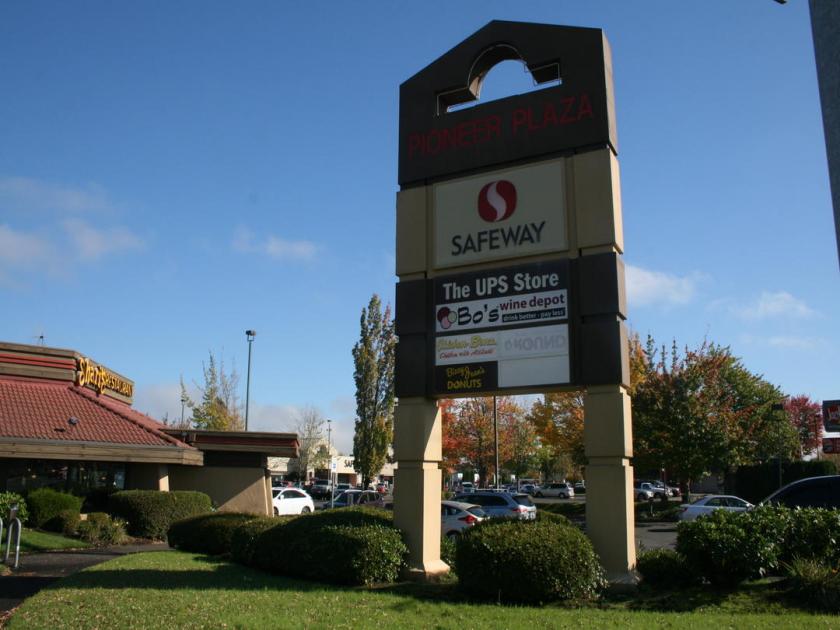
• Pioneer Plaza is a well-established shopping center 96,027 SF, anchored by Safeway.
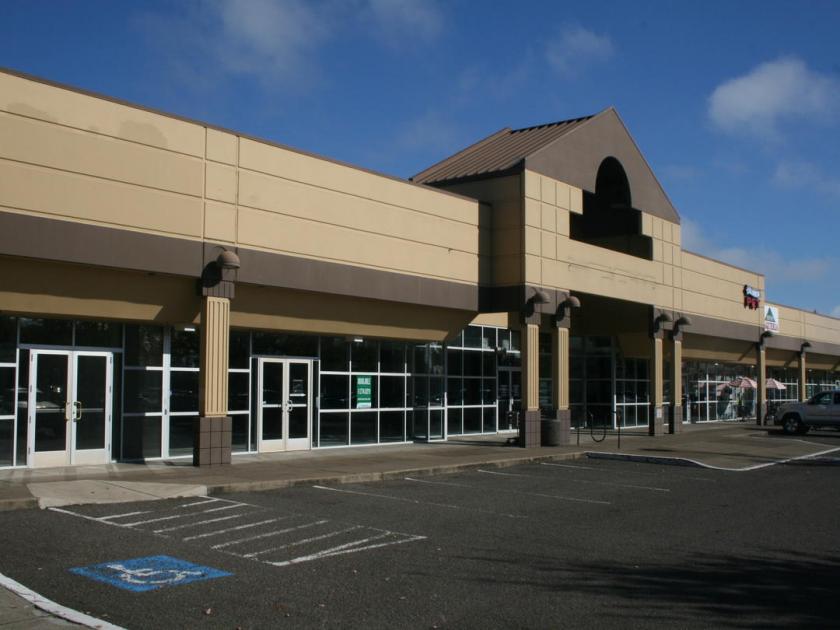
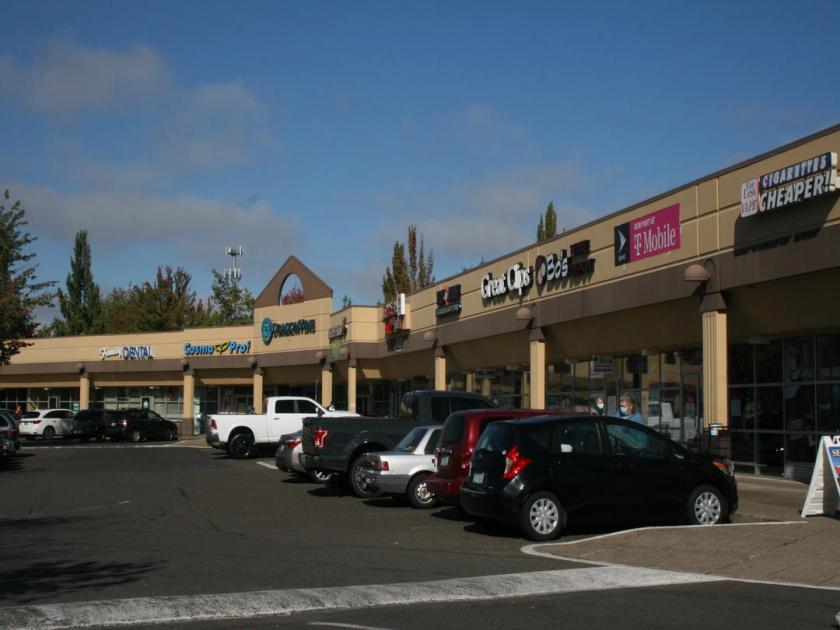
Additional Photos
Listing Agents

Gary Surgeon
O: 503-595-7566
M: 503-936-1989
gary@cra-nw.com
O: 503-595-7566
M: 503-936-1989
gary@cra-nw.com
While we strive to provide the most accurate information, all listing information, and demographic data, is provided by third-parties. As such, MyEListing will not be responsible for the accuracy of the information. It is strongly recommended that you verify all information with the listing agent, and any relevant agencies, prior to making any decisions.


