Health Care and Medical Properties
9950 West Flamingo Road Las Vegas, NV 89147
9950 West Flamingo Road Las Vegas, NV 89147
Details & Description
Property Highlights
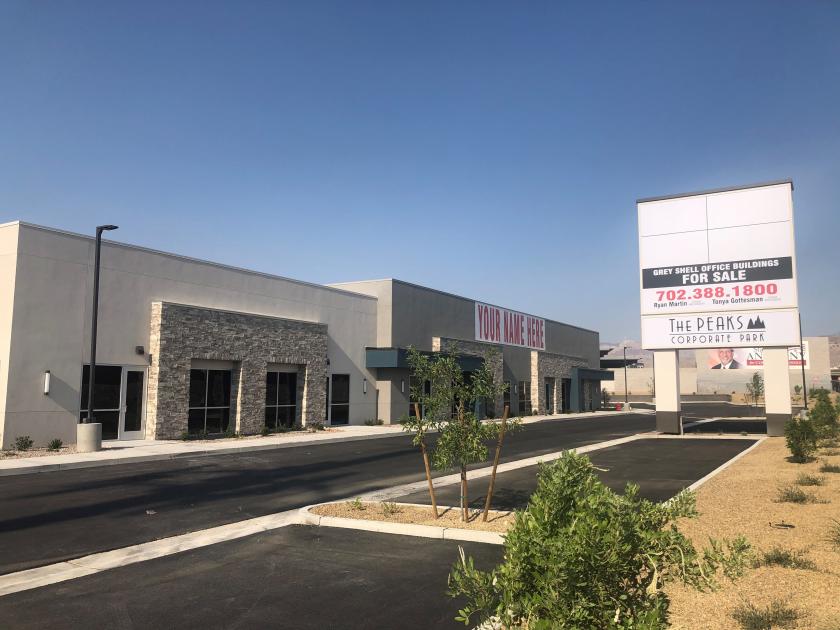
- • -5.5 1,000 sf parking ratio
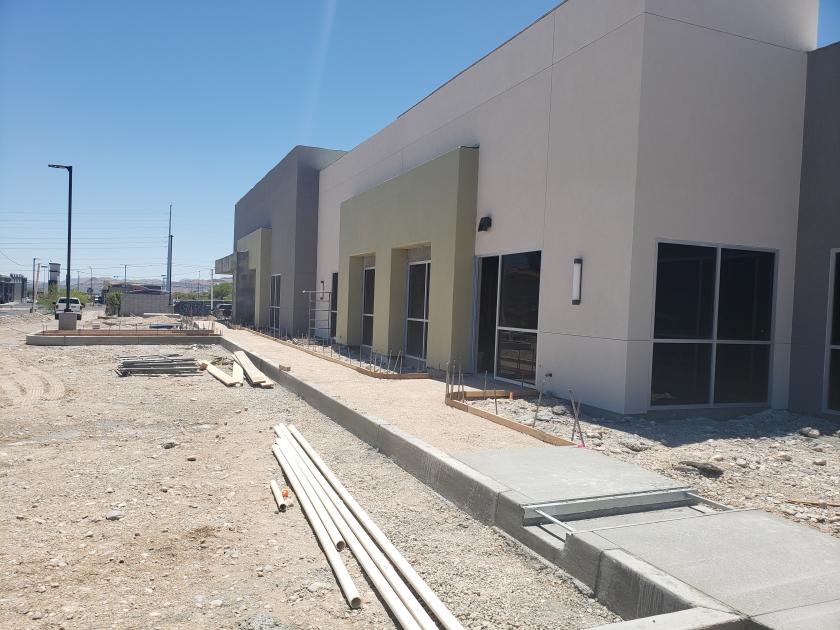
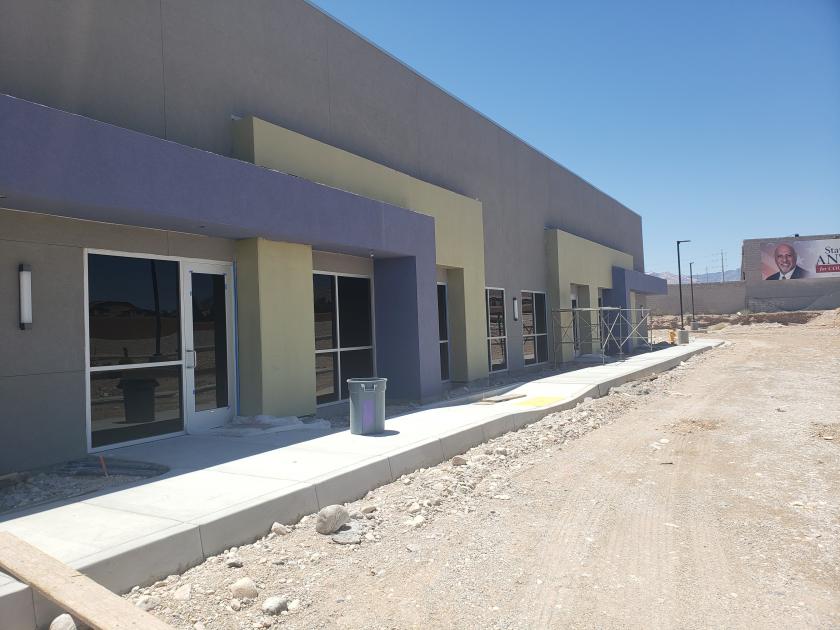
- • Free standing single story buildings
- • Convenient access to the I-215 Freeway
- • Project contiguous to Dignity Health Hospital
Listing Agents

Ryan Martin
O: 702-388-1800
M: 702-941-7382
rmartin@mdlgroup.com
O: 702-388-1800
M: 702-941-7382
rmartin@mdlgroup.com
While we strive to provide the most accurate information, all listing information, and demographic data, is provided by third-parties. As such, MyEListing will not be responsible for the accuracy of the information. It is strongly recommended that you verify all information with the listing agent, and any relevant agencies, prior to making any decisions.