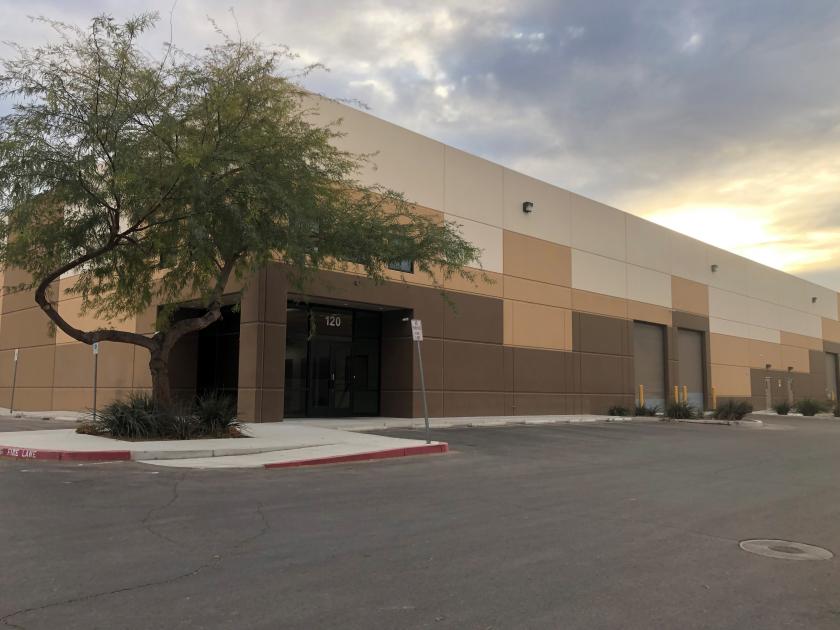
Flex-Office-Warehouse
6650 Spencer Street Las Vegas, NV 89119
6650 Spencer Street Las Vegas, NV 89119
Details & Description
Property Highlights
- • Located near Sunset Road and Paradise Road
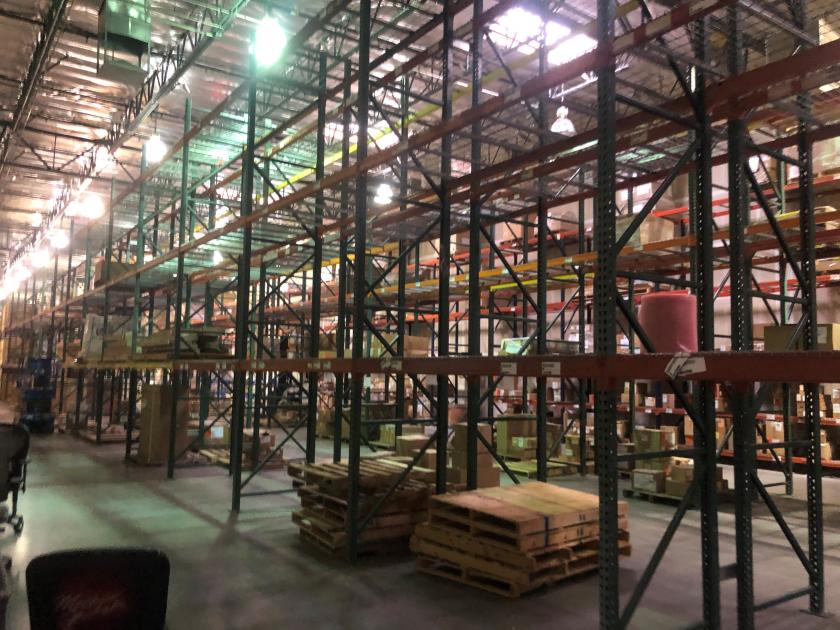
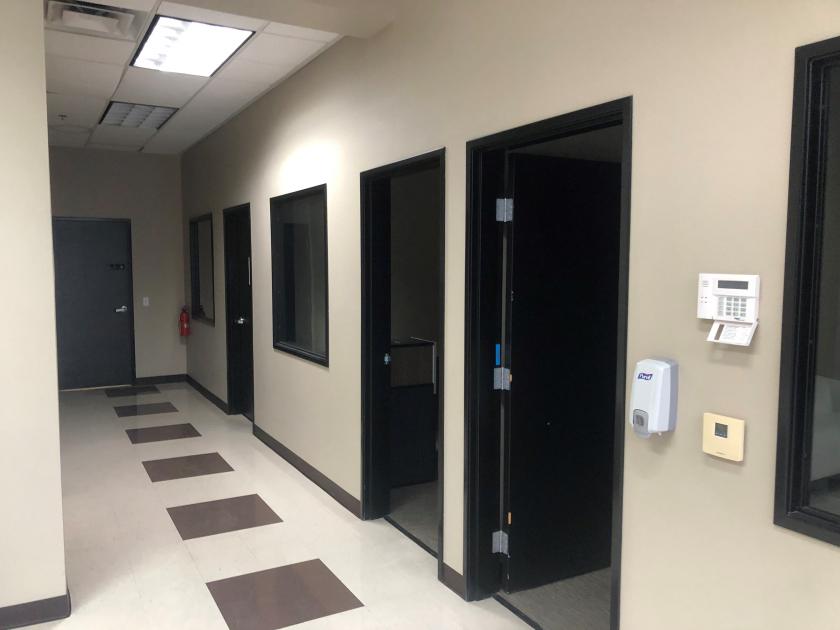
- • Office furniture and warehouse racks available
- • 45 parking stalls
- • ESFR fire sprinklers
- • 4 Dock high loading doors with pit levelers
- • 6 12x14 grade level roll-up doors
Listing Agents

Ryan Martin
O: 702-388-1800
M: 702-941-7382
rmartin@mdlgroup.com
O: 702-388-1800
M: 702-941-7382
rmartin@mdlgroup.com
While we strive to provide the most accurate information, all listing information, and demographic data, is provided by third-parties. As such, MyEListing will not be responsible for the accuracy of the information. It is strongly recommended that you verify all information with the listing agent, and any relevant agencies, prior to making any decisions.