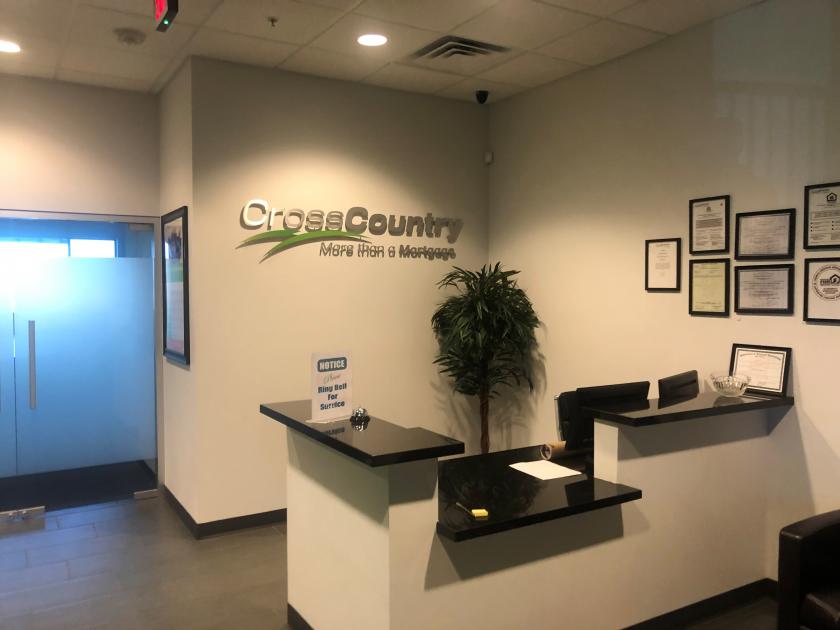
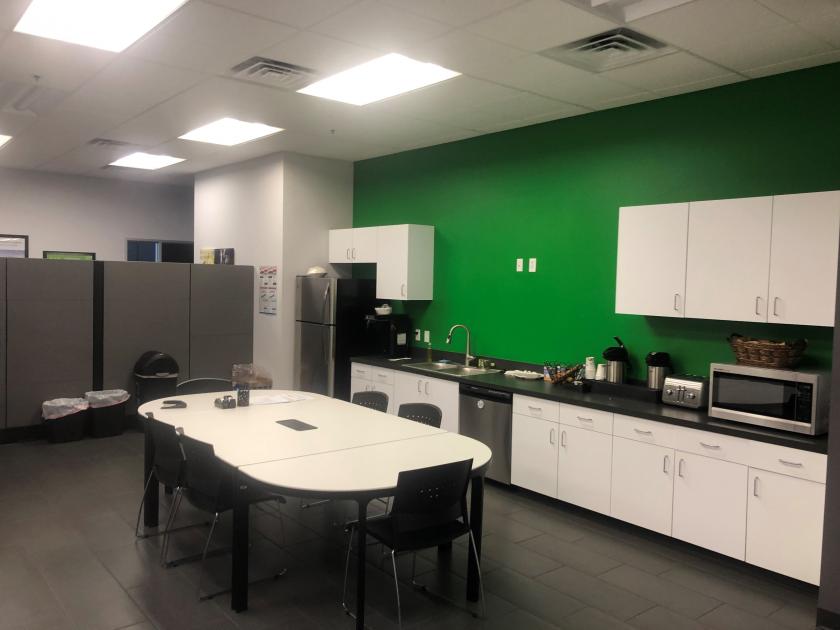
Office Space
6140 Brent Thurman Way Las Vegas, NV 89148
6140 Brent Thurman Way Las Vegas, NV 89148
Details & Description
Property Highlights
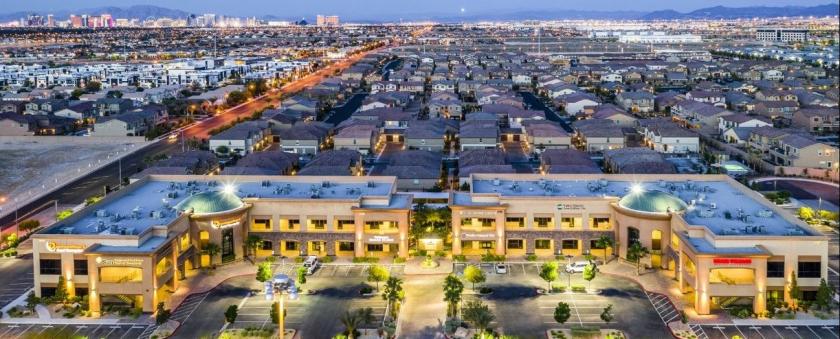
- • Property Name Red Rock Business Center
- • Sublease Rate $1.95 per SF NNN
- • Address 6140 Brent Thurman Way Las Vegas, NV 89118
- • Building SF 5,002 SF Furniture available
- • Parcel Number 163-32-711-001
- • Year Built 2013
Listing Agents

Ryan Martin
O: 702-388-1800
M: 702-941-7382
rmartin@mdlgroup.com
O: 702-388-1800
M: 702-941-7382
rmartin@mdlgroup.com
While we strive to provide the most accurate information, all listing information, and demographic data, is provided by third-parties. As such, MyEListing will not be responsible for the accuracy of the information. It is strongly recommended that you verify all information with the listing agent, and any relevant agencies, prior to making any decisions.