Office Space
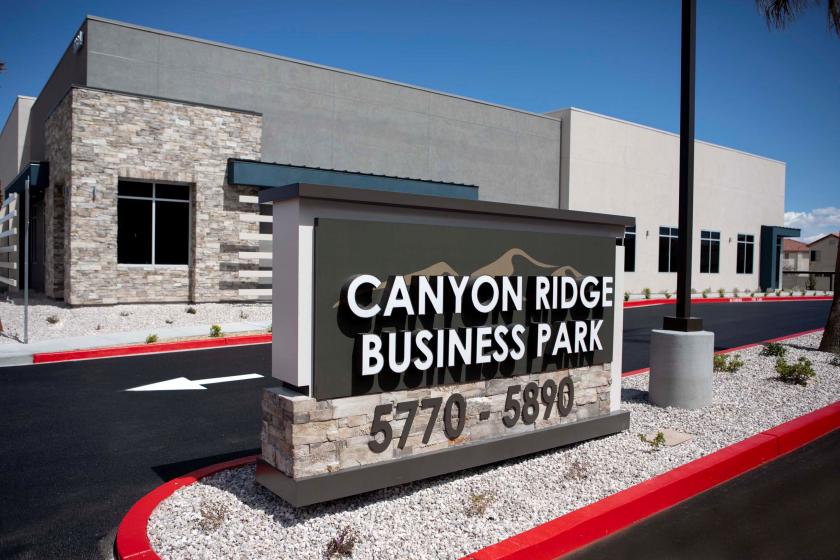
5864 South Durango Drive Las Vegas, NV 89113
5864 South Durango Drive Las Vegas, NV 89113
Details & Description
Property Highlights
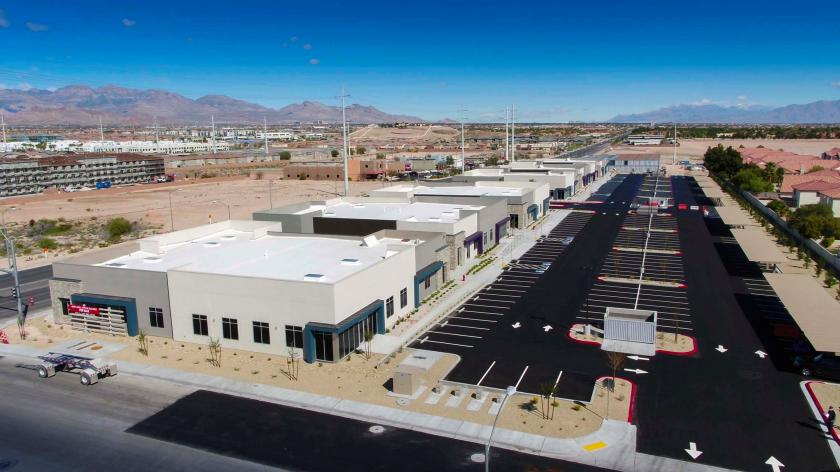
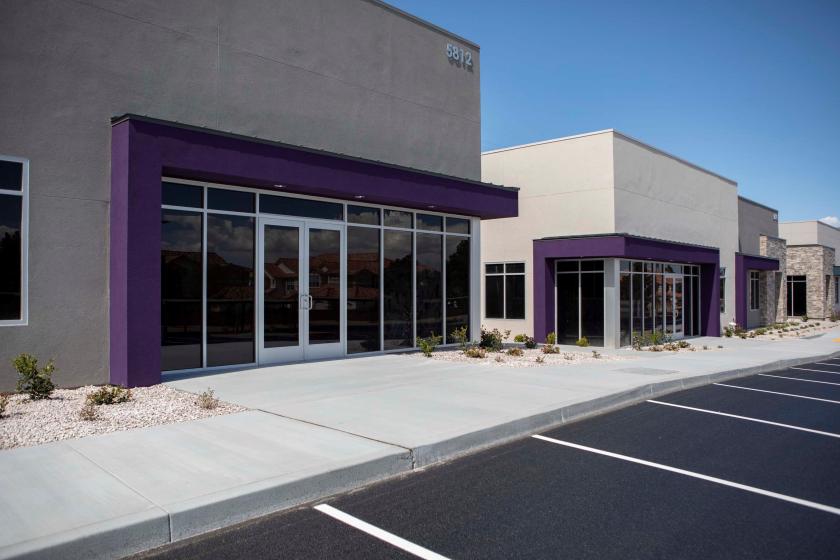
• High visibility location with all buildings fronting Durango
• Parking ratio 5 per 1,000 with covered parking available
Listing Agents

Ryan Martin
O: 702-388-1800
M: 702-941-7382
rmartin@mdlgroup.com
O: 702-388-1800
M: 702-941-7382
rmartin@mdlgroup.com
While we strive to provide the most accurate information, all listing information, and demographic data, is provided by third-parties. As such, MyEListing will not be responsible for the accuracy of the information. It is strongly recommended that you verify all information with the listing agent, and any relevant agencies, prior to making any decisions.