Flex-Office-Warehouse
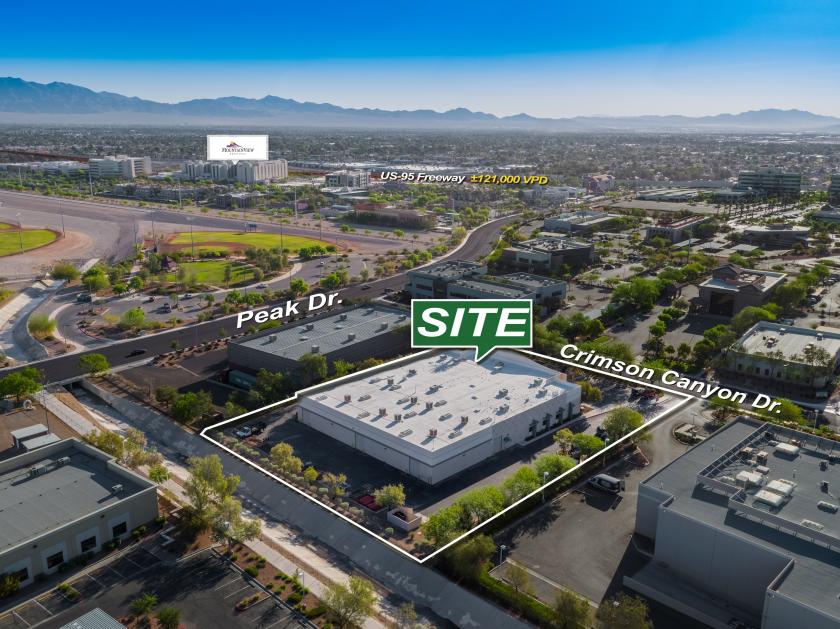
2701 Crimson Canyon Drive Las Vegas, NV 89128
2701 Crimson Canyon Drive Las Vegas, NV 89128
Details & Description
Property Highlights
- • Available 122022 25,706 SF
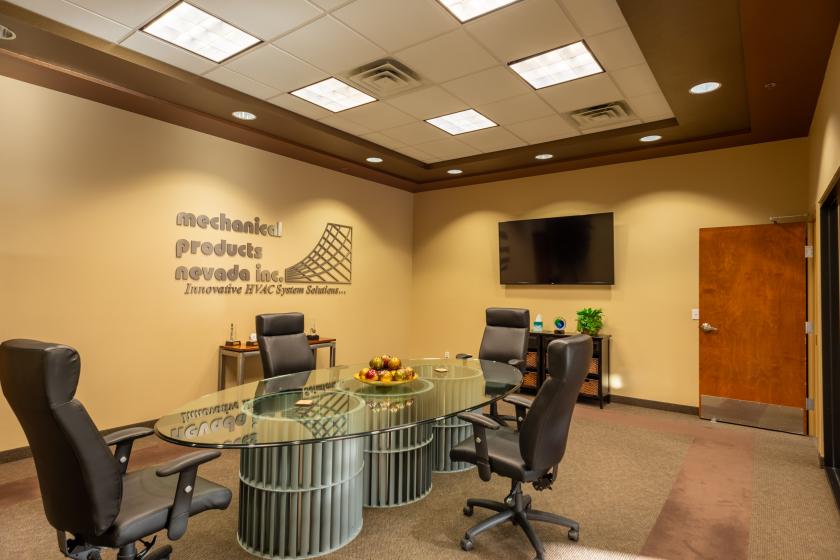
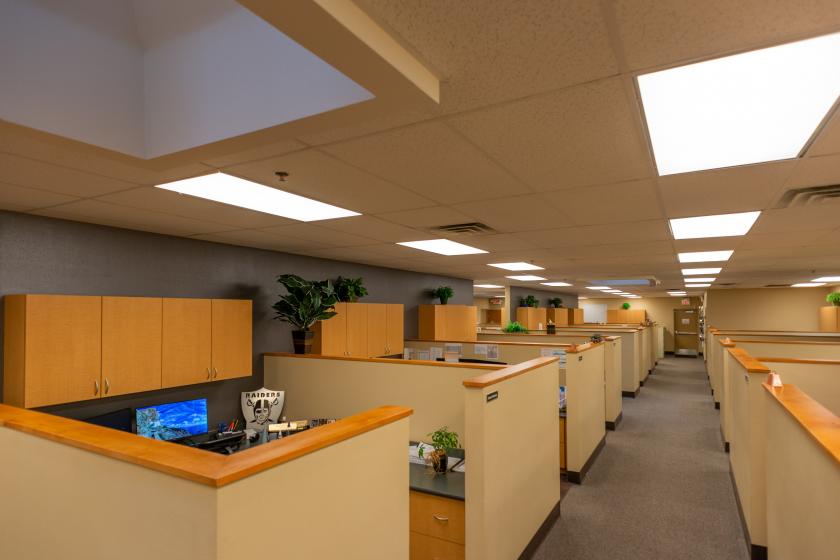
- • Newly built-out offices and cubicles
- • Ideal for a headquarters location
Listing Agents

Ryan Martin
O: 702-388-1800
M: 702-941-7382
rmartin@mdlgroup.com
O: 702-388-1800
M: 702-941-7382
rmartin@mdlgroup.com
While we strive to provide the most accurate information, all listing information, and demographic data, is provided by third-parties. As such, MyEListing will not be responsible for the accuracy of the information. It is strongly recommended that you verify all information with the listing agent, and any relevant agencies, prior to making any decisions.