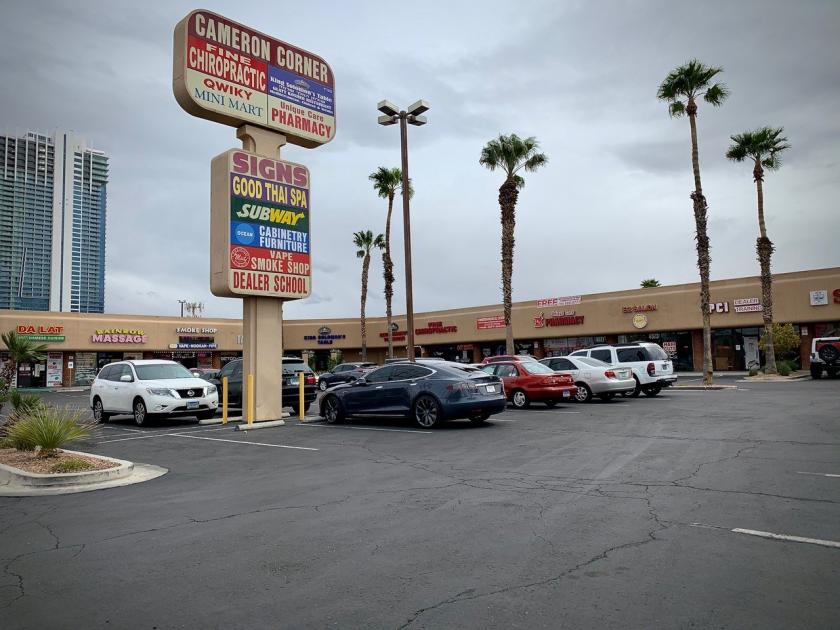
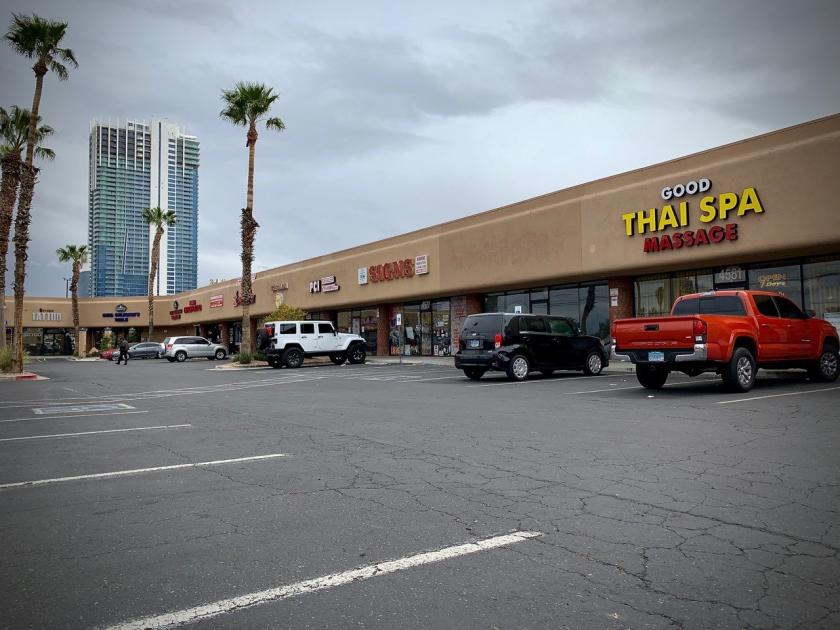
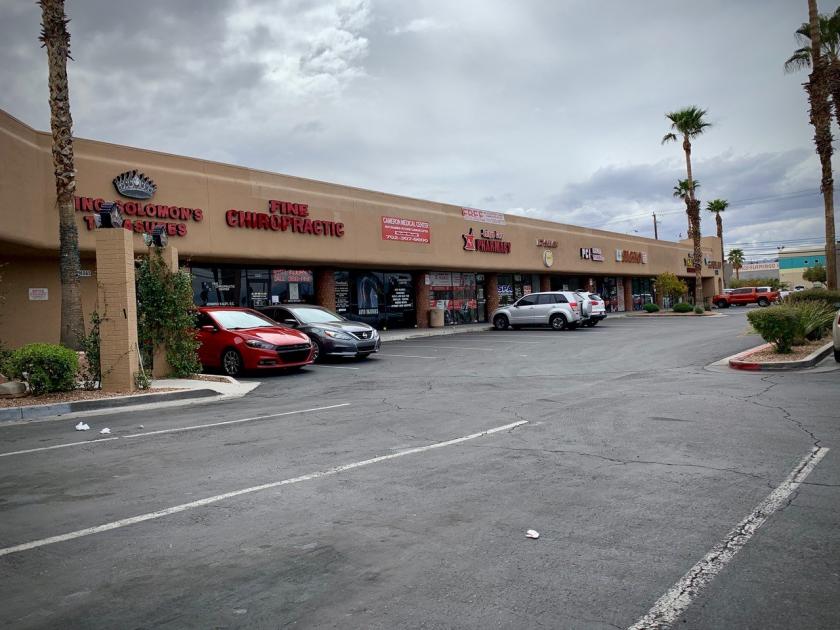
1-Mile | 3-Miles | 5-Miles | ||
---|---|---|---|---|
Total Population | 28,374 | 140,250 | 389,879 | |
Population Median Age | 37 | 38 | 38 | |
Population by Age | 0-9 Yrs | 3532 (12%) | 16275 (11%) | 44930 (11%) |
10-19 Yrs | 2939 (10%) | 15739 (11%) | 44016 (11%) | |
20-29 Yrs | 5272 (18%) | 22197 (15%) | 61310 (15%) | |
30-39 Yrs | 4132 (14%) | 21354 (15%) | 59922 (15%) | |
40-49 Yrs | 4210 (14%) | 18848 (13%) | 52813 (13%) | |
50-59 Yrs | 3232 (11%) | 18176 (12%) | 51409 (13%) | |
60-69 Yrs | 2807 (9%) | 14495 (10%) | 40395 (10%) | |
70+ Yrs | 2249 (7%) | 13166 (9%) | 35084 (8%) | |
Median HH Income | $39,520 | $42,936 | $45,106 | |
Total Household Income | < 24K | 3235 (26%) | 13939 (25%) | 37770 (25%) |
25-49K | 4544 (37%) | 17457 (31%) | 43036 (29%) | |
50-74K | 2408 (19%) | 10227 (18%) | 27393 (18%) | |
75-99K | 1010 (8%) | 5732 (10%) | 16542 (11%) | |
100-199K | 861 (7%) | 5890 (10%) | 18601 (12%) | |
200K+ | 152 (1%) | 1689 (3%) | 4929 (3%) | |
Highest Education Level | No Diploma | 4182 | 18330 | 48700 |
Diploma or GED | 6197 | 31514 | 83645 | |
Some College | 4661 | 23608 | 65912 | |
Assoc. Degree | 1429 | 6911 | 18827 | |
Bachelors Degree | 2401 | 12976 | 38629 | |
Higher Degree | 1001 | 5452 | 17298 | |
Total Housing Units | 15,054 | 74,551 | 184,229 | |
--Owner-Occupied | 2,590 | 18,078 | 54,148 | |
--Renter-Occupied | 9,619 | 36,854 | 94,124 | |
Owner-Occupied Values | < 100K | 1116 | 3196 | 6659 |
100-199K | 809 | 5587 | 16520 | |
200-299K | 319 | 4934 | 16216 | |
300-399K | 253 | 2090 | 6740 | |
400-499K | 54 | 1029 | 3100 | |
500K+ | 38 | 1242 | 4912 | |
Total Working Age Population | 22,934 | 113,832 | 317,750 | |
In Work Force | 15,900 | 75,363 | 208,821 | |
Not In Work Force | 7,034 | 38,469 | 108,930 | |
Workforce Employed | 14,903 | 70,280 | 194,078 | |
Workforce Unemployed | 984 | 5,015 | 14,570 | |
Civlian Workforce | 15,886 | 75,295 | 208,648 | |
Military Workforce | 14 | 69 | 173 | |
Total Households | 12,209 | 54,933 | 148,272 | |
Family Households | 6,198 | 29,655 | 81,152 | |
Non-Family Households | 6,011 | 25,278 | 67,120 | |
Married Couple | 3,434 | 17,122 | 48,153 | |
Other Family | 2,764 | 12,532 | 32,999 | |
Married w/Child | 1,356 | 6,506 | 18,559 | |
Single Male w/Child | 381 | 1,726 | 4,554 | |
Single Female w/Child | 1,129 | 4,569 | 11,093 |
Population Change Last Two Decades - Plus Projection
2000 | % | 2010 | % | 2020 | % | 2030 | |
---|---|---|---|---|---|---|---|
Nevada | 1,998,257 | +35 | 2,700,551 | +17 | 3,149,234 | +10 | 3,460,728 |
Clark County | 1,375,765 | +42 | 1,951,269 | +19 | 2,318,174 | +10 | 2,550,048 |
Nye County | 32,485 | +35 | 43,946 | +11 | 48,864 | +8 | 52,587 |
Total Working Age Population:
Total Households:
Total Working Age Population:
Total Households:
Total Working Age Population:
Total Households: