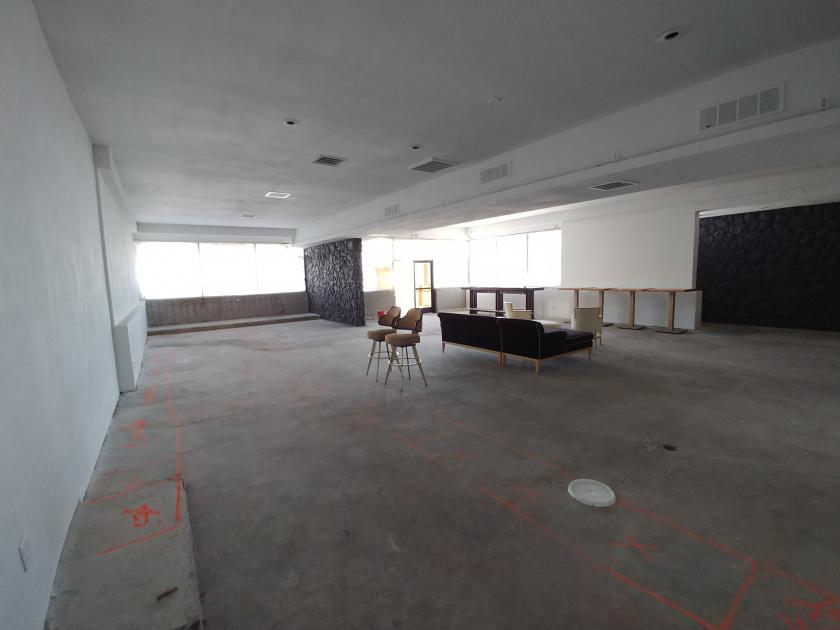
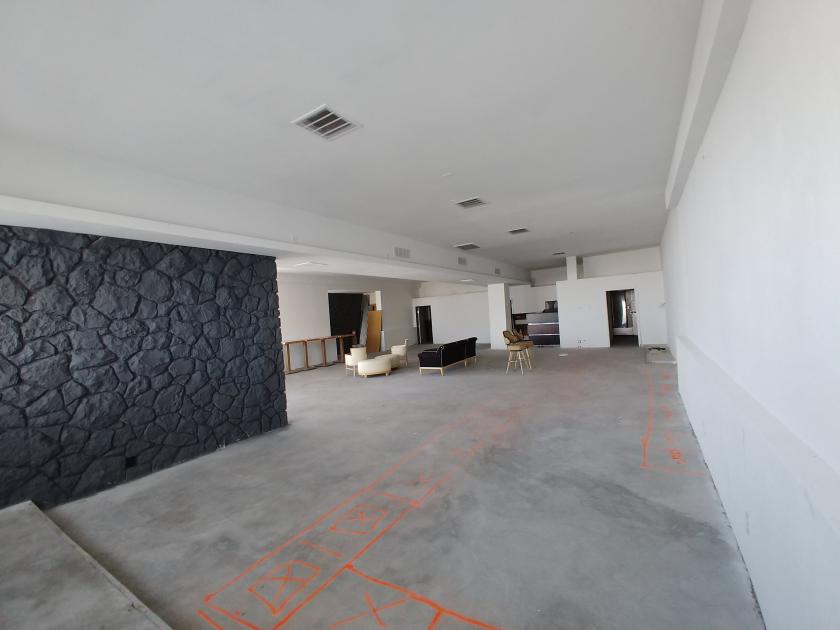
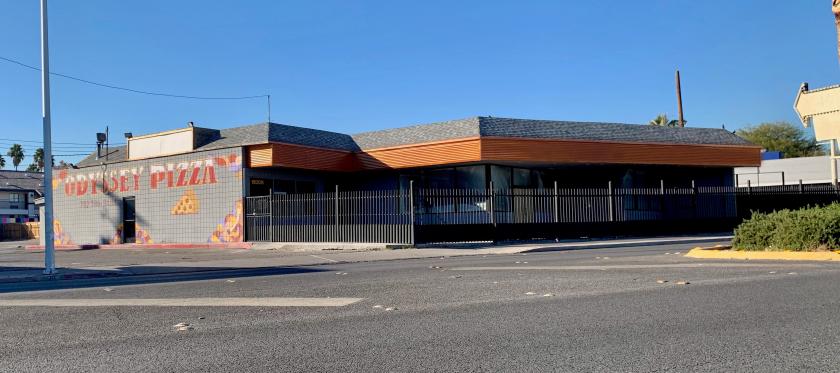
1-Mile | 3-Miles | 5-Miles | ||
---|---|---|---|---|
Total Population | 26,615 | 199,406 | 509,687 | |
Population Median Age | 38 | 36 | 36 | |
Population by Age | 0-9 Yrs | 3553 (13%) | 28903 (14%) | 70610 (13%) |
10-19 Yrs | 3453 (12%) | 27596 (13%) | 72558 (14%) | |
20-29 Yrs | 3224 (12%) | 30120 (15%) | 77943 (15%) | |
30-39 Yrs | 3713 (13%) | 28021 (14%) | 69755 (13%) | |
40-49 Yrs | 3389 (12%) | 25884 (12%) | 68590 (13%) | |
50-59 Yrs | 3659 (13%) | 25029 (12%) | 62676 (12%) | |
60-69 Yrs | 3387 (12%) | 19025 (9%) | 47559 (9%) | |
70+ Yrs | 2235 (8%) | 14828 (7%) | 39996 (7%) | |
Median HH Income | $24,007 | $33,043 | $37,504 | |
Total Household Income | < 24K | 5725 (51%) | 26976 (39%) | 58912 (33%) |
25-49K | 3079 (27%) | 19528 (28%) | 53062 (29%) | |
50-74K | 1179 (10%) | 10476 (15%) | 30089 (16%) | |
75-99K | 518 (4%) | 5402 (7%) | 16110 (9%) | |
100-199K | 496 (4%) | 5599 (8%) | 16913 (9%) | |
200K+ | 53 (0%) | 1105 (1%) | 2793 (1%) | |
Highest Education Level | No Diploma | 6309 | 40239 | 93099 |
Diploma or GED | 5733 | 41171 | 106630 | |
Some College | 3392 | 25729 | 69440 | |
Assoc. Degree | 869 | 6182 | 17274 | |
Bachelors Degree | 1580 | 10474 | 29444 | |
Higher Degree | 376 | 4334 | 12169 | |
Total Housing Units | 13,067 | 83,141 | 215,105 | |
--Owner-Occupied | 2,256 | 22,993 | 65,120 | |
--Renter-Occupied | 8,793 | 46,093 | 112,760 | |
Owner-Occupied Values | < 100K | 548 | 6117 | 14265 |
100-199K | 951 | 9622 | 27369 | |
200-299K | 599 | 4870 | 16347 | |
300-399K | 81 | 1020 | 3581 | |
400-499K | 13 | 460 | 1409 | |
500K+ | 64 | 905 | 2150 | |
Total Working Age Population | 20,800 | 152,595 | 393,884 | |
In Work Force | 11,522 | 91,065 | 244,458 | |
Not In Work Force | 9,278 | 61,530 | 149,426 | |
Workforce Employed | 10,302 | 82,040 | 222,703 | |
Workforce Unemployed | 1,201 | 8,957 | 21,445 | |
Civlian Workforce | 11,503 | 90,997 | 244,149 | |
Military Workforce | 19 | 68 | 309 | |
Total Households | 11,050 | 69,086 | 177,880 | |
Family Households | 4,900 | 37,955 | 101,707 | |
Non-Family Households | 6,149 | 31,131 | 76,173 | |
Married Couple | 2,441 | 19,743 | 55,816 | |
Other Family | 2,460 | 18,212 | 45,890 | |
Married w/Child | 1,141 | 8,606 | 24,100 | |
Single Male w/Child | 317 | 2,603 | 6,337 | |
Single Female w/Child | 1,069 | 7,164 | 17,418 |
Population Change Last Two Decades - Plus Projection
2000 | % | 2010 | % | 2020 | % | 2030 | |
---|---|---|---|---|---|---|---|
Nevada | 1,998,257 | +35 | 2,700,551 | +17 | 3,149,234 | +10 | 3,460,728 |
Clark County | 1,375,765 | +42 | 1,951,269 | +19 | 2,318,174 | +10 | 2,550,048 |
Nye County | 32,485 | +35 | 43,946 | +11 | 48,864 | +8 | 52,587 |
Total Working Age Population:
Total Households:
Total Working Age Population:
Total Households:
Total Working Age Population:
Total Households: