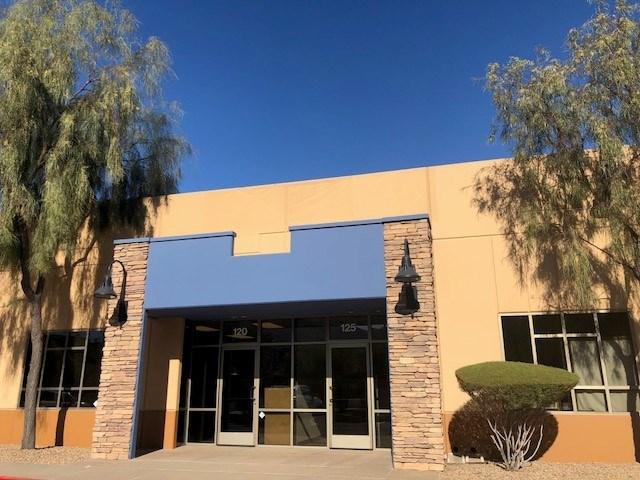
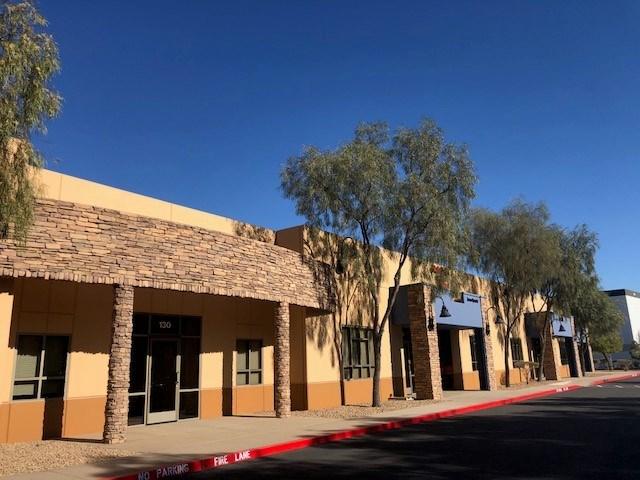
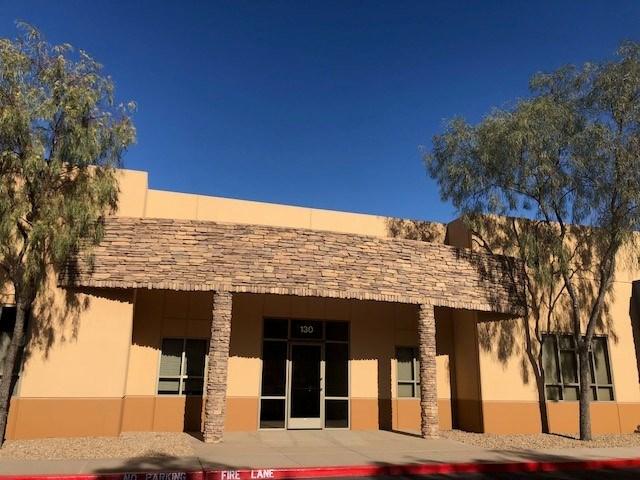
1-Mile | 3-Miles | 5-Miles | ||
---|---|---|---|---|
Total Population | 13,073 | 95,926 | 260,690 | |
Population Median Age | 37 | 40 | 39 | |
Population by Age | 0-9 Yrs | 1472 (11%) | 9892 (10%) | 29491 (11%) |
10-19 Yrs | 1593 (12%) | 11890 (12%) | 33189 (12%) | |
20-29 Yrs | 2187 (16%) | 12372 (12%) | 32693 (12%) | |
30-39 Yrs | 2115 (16%) | 14133 (14%) | 36940 (14%) | |
40-49 Yrs | 1878 (14%) | 13767 (14%) | 35800 (13%) | |
50-59 Yrs | 1591 (12%) | 12887 (13%) | 35320 (13%) | |
60-69 Yrs | 1218 (9%) | 11140 (11%) | 29839 (11%) | |
70+ Yrs | 1019 (7%) | 9846 (10%) | 27418 (10%) | |
Median HH Income | $74,771 | $70,888 | $67,285 | |
Total Household Income | < 24K | 692 (13%) | 5275 (14%) | 14903 (15%) |
25-49K | 848 (16%) | 6944 (19%) | 20587 (21%) | |
50-74K | 973 (19%) | 7098 (19%) | 18878 (19%) | |
75-99K | 827 (16%) | 5350 (14%) | 14008 (14%) | |
100-199K | 1397 (27%) | 9144 (25%) | 22769 (23%) | |
200K+ | 270 (5%) | 2610 (7%) | 6472 (6%) | |
Highest Education Level | No Diploma | 502 | 5581 | 15515 |
Diploma or GED | 2412 | 18659 | 52068 | |
Some College | 2281 | 17542 | 48055 | |
Assoc. Degree | 930 | 5918 | 16081 | |
Bachelors Degree | 2102 | 13697 | 33494 | |
Higher Degree | 1078 | 7575 | 19004 | |
Total Housing Units | 5,373 | 40,425 | 108,894 | |
--Owner-Occupied | 2,457 | 20,879 | 56,954 | |
--Renter-Occupied | 2,551 | 15,543 | 40,663 | |
Owner-Occupied Values | < 100K | 69 | 1235 | 3491 |
100-199K | 256 | 3358 | 10963 | |
200-299K | 892 | 6804 | 18950 | |
300-399K | 726 | 5246 | 13084 | |
400-499K | 454 | 2658 | 6116 | |
500K+ | 60 | 1578 | 4351 | |
Total Working Age Population | 10,541 | 78,767 | 210,711 | |
In Work Force | 7,519 | 52,021 | 136,968 | |
Not In Work Force | 3,023 | 26,746 | 73,743 | |
Workforce Employed | 7,079 | 48,629 | 127,796 | |
Workforce Unemployed | 421 | 3,242 | 8,813 | |
Civlian Workforce | 7,500 | 51,871 | 136,608 | |
Military Workforce | 19 | 150 | 360 | |
Total Households | 5,008 | 36,422 | 97,617 | |
Family Households | 3,212 | 23,359 | 62,326 | |
Non-Family Households | 1,796 | 13,063 | 35,291 | |
Married Couple | 2,254 | 16,833 | 44,392 | |
Other Family | 958 | 6,526 | 17,934 | |
Married w/Child | 988 | 6,472 | 17,207 | |
Single Male w/Child | 180 | 1,004 | 2,555 | |
Single Female w/Child | 232 | 1,919 | 5,699 |
Population Change Last Two Decades - Plus Projection
2000 | % | 2010 | % | 2020 | % | 2030 | |
---|---|---|---|---|---|---|---|
Nevada | 1,998,257 | +35 | 2,700,551 | +17 | 3,149,234 | +10 | 3,460,728 |
Clark County | 1,375,765 | +42 | 1,951,269 | +19 | 2,318,174 | +10 | 2,550,048 |
Nye County | 32,485 | +35 | 43,946 | +11 | 48,864 | +8 | 52,587 |
Total Working Age Population:
Total Households:
Total Working Age Population:
Total Households:
Total Working Age Population:
Total Households: