Office Space
7391 Prairie Falcon Road Las Vegas, NV 89128
7391 Prairie Falcon Road Las Vegas, NV 89128

Details & Description
Property Highlights
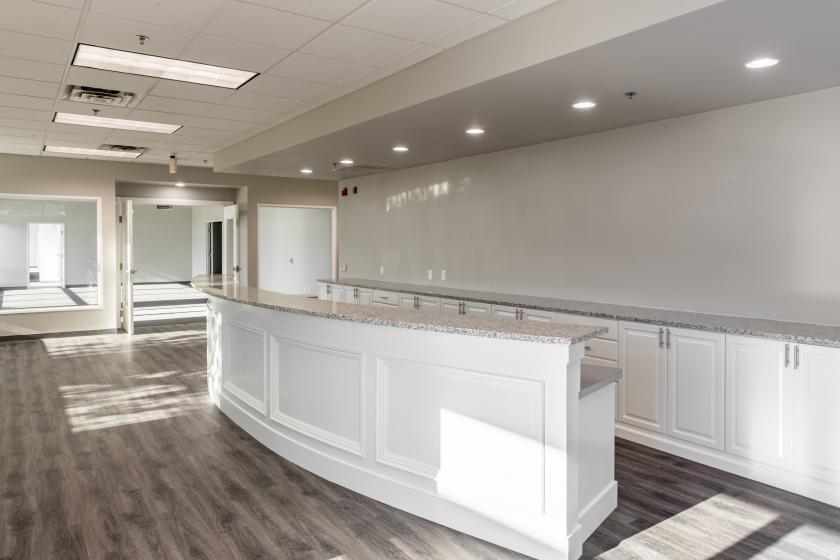
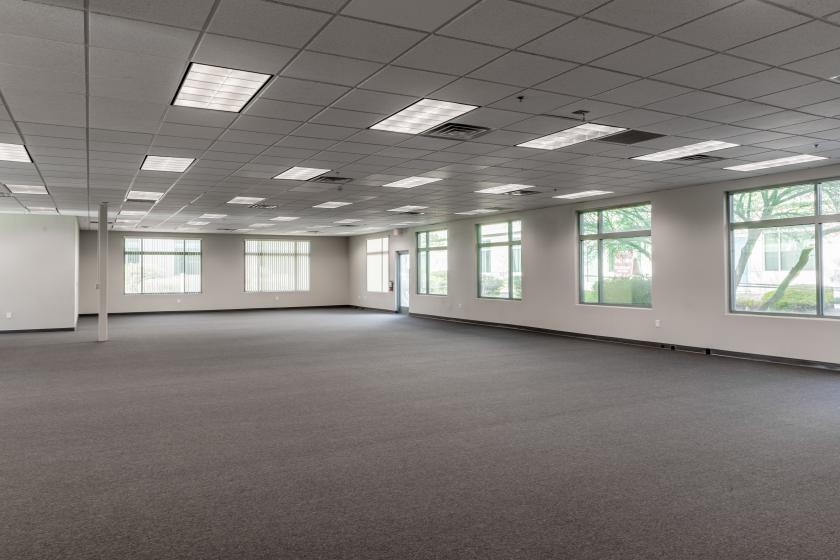
- • Perfect for office or medical user
- • Frontage on Prairie Falcon
- • Summerlin adjacent
- • Building is also available for SALE
Listing Agents

Jarrad Katz
M: 702-610-1002
jkatz@mdlgroup.com
M: 702-610-1002
jkatz@mdlgroup.com
While we strive to provide the most accurate information, all listing information, and demographic data, is provided by third-parties. As such, MyEListing will not be responsible for the accuracy of the information. It is strongly recommended that you verify all information with the listing agent, and any relevant agencies, prior to making any decisions.