Office Space
6141 Sherry Lane Dallas, TX 75225
6141 Sherry Lane Dallas, TX 75225

Details & Description
Property Highlights
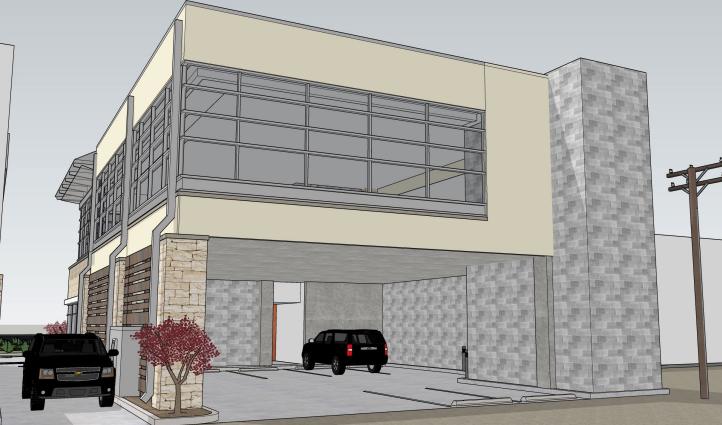
- • Two-Story Building
- • Ample Parking in Front and Back of Building
- • 30 Foot Ceilings
- • Numerous Walkable Amenities
Listing Agents

Geoff Hangartner
O: 512-538-0095
ghangartner@hpitx.com
O: 512-538-0095
ghangartner@hpitx.com

Ben Cuzen
O: 972-850-2714
bcuzen@hpitx.com
O: 972-850-2714
bcuzen@hpitx.com
While we strive to provide the most accurate information, all listing information, and demographic data, is provided by third-parties. As such, MyEListing will not be responsible for the accuracy of the information. It is strongly recommended that you verify all information with the listing agent, and any relevant agencies, prior to making any decisions.