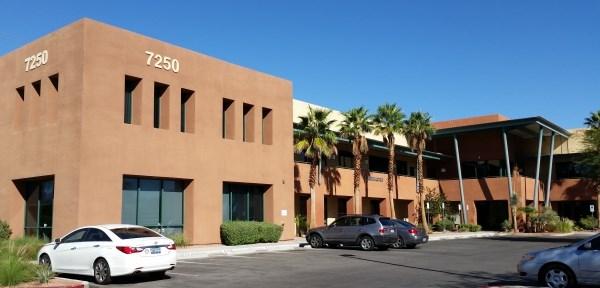
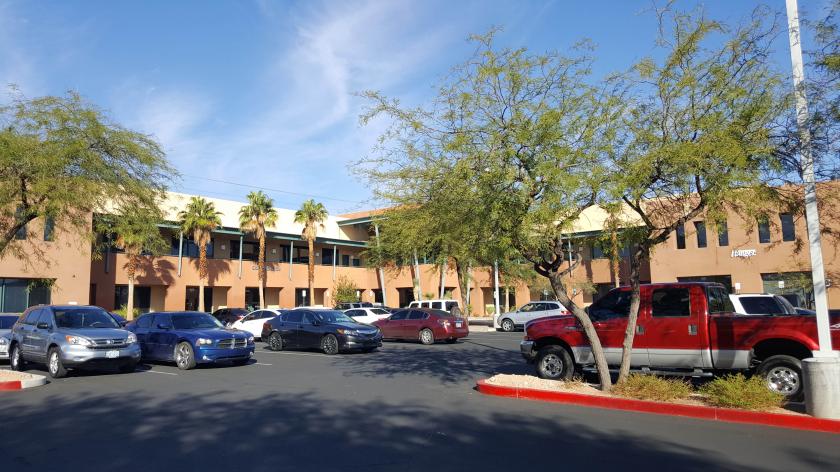
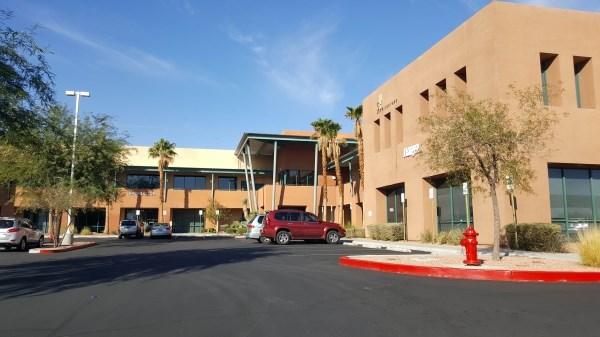
1-Mile | 3-Miles | 5-Miles | ||
---|---|---|---|---|
Total Population | 16,049 | 181,040 | 404,814 | |
Population Median Age | 37 | 39 | 40 | |
Population by Age | 0-9 Yrs | 2156 (13%) | 22405 (12%) | 48130 (11%) |
10-19 Yrs | 1706 (10%) | 21897 (12%) | 48972 (12%) | |
20-29 Yrs | 2908 (18%) | 24950 (13%) | 52585 (12%) | |
30-39 Yrs | 2517 (15%) | 23642 (13%) | 50748 (12%) | |
40-49 Yrs | 1758 (10%) | 23662 (13%) | 53847 (13%) | |
50-59 Yrs | 2037 (12%) | 23951 (13%) | 54939 (13%) | |
60-69 Yrs | 1708 (10%) | 21238 (11%) | 48489 (11%) | |
70+ Yrs | 1260 (7%) | 19294 (10%) | 47105 (11%) | |
Median HH Income | $51,429 | $55,656 | $58,641 | |
Total Household Income | < 24K | 1354 (20%) | 13592 (20%) | 27980 (18%) |
25-49K | 1858 (28%) | 17156 (25%) | 36805 (24%) | |
50-74K | 1322 (19%) | 12915 (19%) | 28530 (18%) | |
75-99K | 931 (14%) | 9450 (13%) | 21444 (14%) | |
100-199K | 998 (15%) | 12080 (17%) | 28731 (19%) | |
200K+ | 161 (2%) | 2566 (3%) | 7551 (4%) | |
Highest Education Level | No Diploma | 1251 | 16945 | 37061 |
Diploma or GED | 2967 | 37223 | 82838 | |
Some College | 2882 | 31836 | 72304 | |
Assoc. Degree | 1022 | 10422 | 23286 | |
Bachelors Degree | 1864 | 19038 | 44043 | |
Higher Degree | 885 | 9597 | 24046 | |
Total Housing Units | 7,474 | 74,935 | 166,802 | |
--Owner-Occupied | 2,448 | 36,287 | 87,013 | |
--Renter-Occupied | 4,176 | 31,471 | 64,028 | |
Owner-Occupied Values | < 100K | 245 | 2785 | 5185 |
100-199K | 525 | 10303 | 22865 | |
200-299K | 884 | 12484 | 29229 | |
300-399K | 448 | 6095 | 15172 | |
400-499K | 192 | 2389 | 5760 | |
500K+ | 154 | 2231 | 8802 | |
Total Working Age Population | 12,776 | 145,102 | 326,315 | |
In Work Force | 8,898 | 92,402 | 203,441 | |
Not In Work Force | 3,878 | 52,700 | 122,874 | |
Workforce Employed | 8,357 | 85,953 | 189,662 | |
Workforce Unemployed | 523 | 6,173 | 13,094 | |
Civlian Workforce | 8,879 | 92,127 | 202,756 | |
Military Workforce | 19 | 275 | 685 | |
Total Households | 6,624 | 67,758 | 151,041 | |
Family Households | 3,839 | 41,548 | 95,537 | |
Non-Family Households | 2,785 | 26,210 | 55,504 | |
Married Couple | 2,353 | 27,621 | 65,422 | |
Other Family | 1,486 | 13,927 | 30,115 | |
Married w/Child | 834 | 9,906 | 22,937 | |
Single Male w/Child | 252 | 1,960 | 4,027 | |
Single Female w/Child | 607 | 4,779 | 10,122 |
Population Change Last Two Decades - Plus Projection
2000 | % | 2010 | % | 2020 | % | 2030 | |
---|---|---|---|---|---|---|---|
Nevada | 1,998,257 | +35 | 2,700,551 | +17 | 3,149,234 | +10 | 3,460,728 |
Clark County | 1,375,765 | +42 | 1,951,269 | +19 | 2,318,174 | +10 | 2,550,048 |
Nye County | 32,485 | +35 | 43,946 | +11 | 48,864 | +8 | 52,587 |
Total Working Age Population:
Total Households:
Total Working Age Population:
Total Households:
Total Working Age Population:
Total Households: