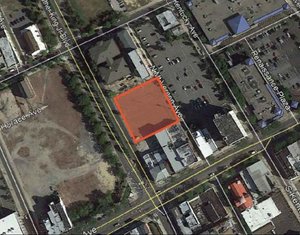
1-Mile | 3-Miles | 5-Miles | ||
---|---|---|---|---|
Total Population | 6,646 | 72,139 | 185,329 | |
Population Median Age | 37 | 39 | 39 | |
Population by Age | 0-9 Yrs | 896 (13%) | 8415 (11%) | 21303 (11%) |
10-19 Yrs | 900 (13%) | 8796 (12%) | 22873 (12%) | |
20-29 Yrs | 980 (14%) | 10332 (14%) | 25626 (13%) | |
30-39 Yrs | 836 (12%) | 8830 (12%) | 22825 (12%) | |
40-49 Yrs | 891 (13%) | 9279 (12%) | 24501 (13%) | |
50-59 Yrs | 820 (12%) | 10340 (14%) | 27853 (15%) | |
60-69 Yrs | 818 (12%) | 9193 (12%) | 22898 (12%) | |
70+ Yrs | 505 (7%) | 6954 (9%) | 17450 (9%) | |
Median HH Income | $86,335 | $78,957 | $79,183 | |
Total Household Income | < 24K | 276 (11%) | 3130 (11%) | 8664 (12%) |
25-49K | 501 (21%) | 5186 (19%) | 12253 (17%) | |
50-74K | 244 (10%) | 4454 (16%) | 11873 (17%) | |
75-99K | 320 (13%) | 3666 (13%) | 9748 (14%) | |
100-199K | 776 (33%) | 8057 (30%) | 20819 (30%) | |
200K+ | 215 (9%) | 2207 (8%) | 5486 (7%) | |
Highest Education Level | No Diploma | 229 | 3532 | 9003 |
Diploma or GED | 1136 | 15749 | 42147 | |
Some College | 837 | 10416 | 26895 | |
Assoc. Degree | 459 | 4578 | 11593 | |
Bachelors Degree | 1140 | 10866 | 27287 | |
Higher Degree | 475 | 4972 | 12065 | |
Total Housing Units | 2,457 | 28,578 | 73,585 | |
--Owner-Occupied | 1,512 | 18,900 | 50,598 | |
--Renter-Occupied | 819 | 7,801 | 18,246 | |
Owner-Occupied Values | < 100K | 45 | 1270 | 4032 |
100-199K | 252 | 6903 | 20746 | |
200-299K | 849 | 7828 | 18692 | |
300-399K | 309 | 2137 | 5078 | |
400-499K | 26 | 375 | 1217 | |
500K+ | 32 | 387 | 832 | |
Total Working Age Population | 5,175 | 58,043 | 149,496 | |
In Work Force | 3,734 | 39,807 | 103,568 | |
Not In Work Force | 1,441 | 18,236 | 45,929 | |
Workforce Employed | 3,502 | 37,426 | 97,324 | |
Workforce Unemployed | 226 | 2,370 | 6,210 | |
Civlian Workforce | 3,728 | 39,796 | 103,533 | |
Military Workforce | 6 | 11 | 34 | |
Total Households | 2,331 | 26,701 | 68,844 | |
Family Households | 1,655 | 18,563 | 47,562 | |
Non-Family Households | 677 | 8,138 | 21,282 | |
Married Couple | 1,223 | 13,409 | 34,212 | |
Other Family | 432 | 5,154 | 13,350 | |
Married w/Child | 555 | 5,121 | 13,229 | |
Single Male w/Child | 97 | 530 | 1,564 | |
Single Female w/Child | 212 | 1,975 | 4,888 |
Population Change Last Two Decades - Plus Projection
2000 | % | 2010 | % | 2020 | % | 2030 | |
---|---|---|---|---|---|---|---|
New Jersey | 8,414,350 | +4 | 8,791,894 | +4 | 9,132,700 | +4 | 9,530,900 |
Atlantic County | 252,552 | +9 | 274,549 | +1 | 276,200 | +2 | 280,600 |
Burlington County | 423,394 | +6 | 448,734 | 0 | 450,000 | +3 | 464,900 |
Camden County | 508,932 | +1 | 513,657 | 0 | 511,800 | +2 | 521,000 |
Gloucester County | 254,673 | +13 | 288,288 | +1 | 292,000 | +5 | 305,800 |
Salem County | 64,285 | +3 | 66,083 | -5 | 63,000 | -3 | 61,000 |
Total Working Age Population:
Total Households:
Total Working Age Population:
Total Households:
Total Working Age Population:
Total Households: