Commercial Land
2111 U.S. 322 Swedesboro, NJ 08085
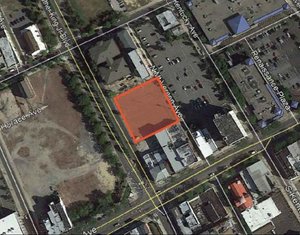
2111 U.S. 322 Swedesboro, NJ 08085

Details & Description
Property Highlights
• Nearby amenities Downtown Swedesboro, Kingsway Regional High School, Pureland Industrial Park, Amazon Fulfillment
• -2.25 miles west of Exit 2 on the NJ Turnpike and -1.5 miles east of Exit 11 on I-295
Listing Agents

Corinne Giletto
O: 856-797-1919
corinne.giletto@vantageres.com
O: 856-797-1919
corinne.giletto@vantageres.com
While we strive to provide the most accurate information, all listing information, and demographic data, is provided by third-parties. As such, MyEListing will not be responsible for the accuracy of the information. It is strongly recommended that you verify all information with the listing agent, and any relevant agencies, prior to making any decisions.