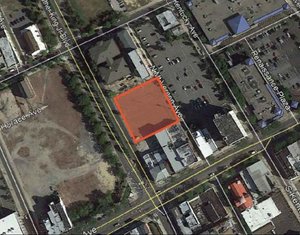
1-Mile | 3-Miles | 5-Miles | ||
---|---|---|---|---|
Total Population | 4,279 | 50,151 | 178,337 | |
Population Median Age | 43 | 40 | 40 | |
Population by Age | 0-9 Yrs | 423 (9%) | 5794 (11%) | 19436 (10%) |
10-19 Yrs | 456 (10%) | 5945 (11%) | 20758 (11%) | |
20-29 Yrs | 569 (13%) | 6473 (12%) | 24765 (13%) | |
30-39 Yrs | 477 (11%) | 6013 (11%) | 22125 (12%) | |
40-49 Yrs | 543 (12%) | 6285 (12%) | 22915 (12%) | |
50-59 Yrs | 574 (13%) | 7460 (14%) | 25761 (14%) | |
60-69 Yrs | 572 (13%) | 6698 (13%) | 23441 (13%) | |
70+ Yrs | 664 (15%) | 5483 (10%) | 19135 (10%) | |
Median HH Income | $80,102 | $85,351 | $79,208 | |
Total Household Income | < 24K | 130 (7%) | 1927 (10%) | 8869 (13%) |
25-49K | 411 (24%) | 3275 (18%) | 12033 (17%) | |
50-74K | 236 (14%) | 2803 (15%) | 11372 (16%) | |
75-99K | 237 (14%) | 2566 (14%) | 9458 (13%) | |
100-199K | 378 (22%) | 5646 (31%) | 20146 (29%) | |
200K+ | 260 (15%) | 1919 (10%) | 5855 (8%) | |
Highest Education Level | No Diploma | 249 | 2419 | 8838 |
Diploma or GED | 830 | 10856 | 41004 | |
Some College | 595 | 6598 | 25305 | |
Assoc. Degree | 273 | 3649 | 11435 | |
Bachelors Degree | 892 | 8195 | 27103 | |
Higher Degree | 287 | 3596 | 12707 | |
Total Housing Units | 1,770 | 19,279 | 72,724 | |
--Owner-Occupied | 1,324 | 14,374 | 50,098 | |
--Renter-Occupied | 328 | 3,761 | 17,636 | |
Owner-Occupied Values | < 100K | 73 | 520 | 2876 |
100-199K | 370 | 4477 | 21474 | |
200-299K | 548 | 6168 | 18580 | |
300-399K | 311 | 2416 | 5144 | |
400-499K | 11 | 461 | 1162 | |
500K+ | 11 | 331 | 861 | |
Total Working Age Population | 3,544 | 40,663 | 145,691 | |
In Work Force | 2,355 | 27,661 | 98,932 | |
Not In Work Force | 1,189 | 13,002 | 46,759 | |
Workforce Employed | 2,225 | 26,184 | 93,086 | |
Workforce Unemployed | 130 | 1,465 | 5,811 | |
Civlian Workforce | 2,355 | 27,650 | 98,898 | |
Military Workforce | 0 | 11 | 35 | |
Total Households | 1,652 | 18,135 | 67,733 | |
Family Households | 1,258 | 13,275 | 45,416 | |
Non-Family Households | 394 | 4,861 | 22,318 | |
Married Couple | 925 | 10,123 | 33,312 | |
Other Family | 333 | 3,151 | 12,104 | |
Married w/Child | 306 | 3,750 | 12,581 | |
Single Male w/Child | 41 | 452 | 1,180 | |
Single Female w/Child | 55 | 1,043 | 4,256 |
Population Change Last Two Decades - Plus Projection
2000 | % | 2010 | % | 2020 | % | 2030 | |
---|---|---|---|---|---|---|---|
New Jersey | 8,414,350 | +4 | 8,791,894 | +4 | 9,132,700 | +4 | 9,530,900 |
Burlington County | 423,394 | +6 | 448,734 | 0 | 450,000 | +3 | 464,900 |
Camden County | 508,932 | +1 | 513,657 | 0 | 511,800 | +2 | 521,000 |
Gloucester County | 254,673 | +13 | 288,288 | +1 | 292,000 | +5 | 305,800 |
Salem County | 64,285 | +3 | 66,083 | -5 | 63,000 | -3 | 61,000 |
Total Working Age Population:
Total Households:
Total Working Age Population:
Total Households:
Total Working Age Population:
Total Households: