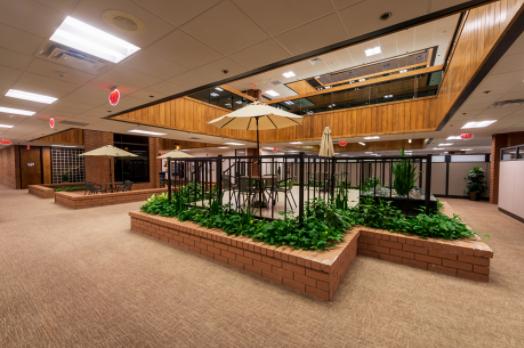
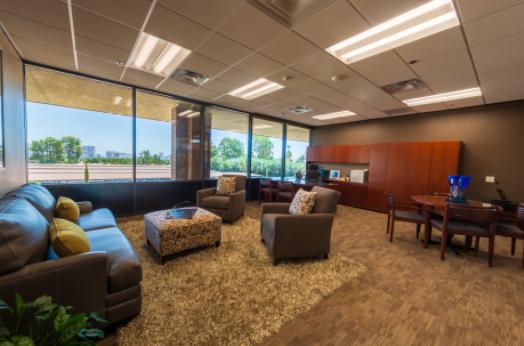
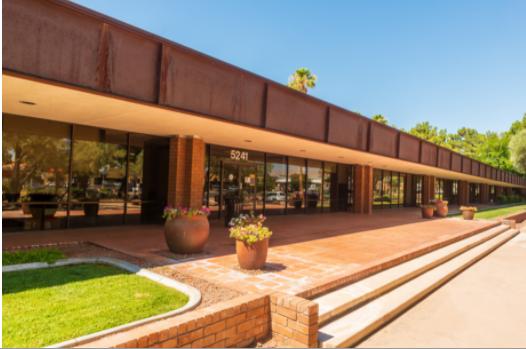
1-Mile | 3-Miles | 5-Miles | ||
---|---|---|---|---|
Total Population | 29,654 | 163,249 | 420,844 | |
Population Median Age | 36 | 39 | 38 | |
Population by Age | 0-9 Yrs | 4022 (13%) | 19264 (11%) | 48093 (11%) |
10-19 Yrs | 3553 (11%) | 18456 (11%) | 48000 (11%) | |
20-29 Yrs | 4720 (15%) | 25342 (15%) | 66841 (15%) | |
30-39 Yrs | 4542 (15%) | 24075 (14%) | 63066 (14%) | |
40-49 Yrs | 4307 (14%) | 21704 (13%) | 57152 (13%) | |
50-59 Yrs | 3264 (11%) | 21298 (13%) | 55348 (13%) | |
60-69 Yrs | 3002 (10%) | 17109 (10%) | 43520 (10%) | |
70+ Yrs | 2243 (7%) | 16001 (9%) | 38825 (9%) | |
Median HH Income | $41,847 | $44,579 | $44,935 | |
Total Household Income | < 24K | 2897 (25%) | 14796 (23%) | 40588 (25%) |
25-49K | 3753 (33%) | 19331 (31%) | 47113 (29%) | |
50-74K | 2201 (19%) | 11470 (18%) | 29747 (18%) | |
75-99K | 1084 (9%) | 7047 (11%) | 18001 (11%) | |
100-199K | 1054 (9%) | 7109 (11%) | 20008 (12%) | |
200K+ | 169 (1%) | 2079 (3%) | 5275 (3%) | |
Highest Education Level | No Diploma | 4589 | 21135 | 52097 |
Diploma or GED | 6352 | 36261 | 90733 | |
Some College | 4481 | 27296 | 71883 | |
Assoc. Degree | 1383 | 8028 | 20794 | |
Bachelors Degree | 2386 | 15025 | 40278 | |
Higher Degree | 907 | 6721 | 18554 | |
Total Housing Units | 12,957 | 79,908 | 198,218 | |
--Owner-Occupied | 3,091 | 22,908 | 59,846 | |
--Renter-Occupied | 8,067 | 38,923 | 100,886 | |
Owner-Occupied Values | < 100K | 755 | 3674 | 7056 |
100-199K | 762 | 7143 | 18954 | |
200-299K | 896 | 6342 | 17810 | |
300-399K | 453 | 2605 | 7678 | |
400-499K | 128 | 1228 | 3324 | |
500K+ | 97 | 1916 | 5025 | |
Total Working Age Population | 23,428 | 132,032 | 342,782 | |
In Work Force | 16,017 | 87,026 | 223,645 | |
Not In Work Force | 7,411 | 45,006 | 119,137 | |
Workforce Employed | 14,892 | 81,275 | 207,753 | |
Workforce Unemployed | 1,121 | 5,684 | 15,663 | |
Civlian Workforce | 16,013 | 86,959 | 223,417 | |
Military Workforce | 4 | 67 | 229 | |
Total Households | 11,158 | 61,831 | 160,731 | |
Family Households | 6,583 | 34,803 | 88,464 | |
Non-Family Households | 4,574 | 27,028 | 72,268 | |
Married Couple | 3,615 | 20,508 | 52,680 | |
Other Family | 2,968 | 14,294 | 35,784 | |
Married w/Child | 1,416 | 7,836 | 19,866 | |
Single Male w/Child | 381 | 1,885 | 4,782 | |
Single Female w/Child | 1,162 | 5,073 | 12,020 |
Population Change Last Two Decades - Plus Projection
2000 | % | 2010 | % | 2020 | % | 2030 | |
---|---|---|---|---|---|---|---|
Nevada | 1,998,257 | +35 | 2,700,551 | +17 | 3,149,234 | +10 | 3,460,728 |
Clark County | 1,375,765 | +42 | 1,951,269 | +19 | 2,318,174 | +10 | 2,550,048 |
Nye County | 32,485 | +35 | 43,946 | +11 | 48,864 | +8 | 52,587 |
Total Working Age Population:
Total Households:
Total Working Age Population:
Total Households:
Total Working Age Population:
Total Households: