Commercial Land
501 Cooper Rd Voorhees Township, NJ 08043
501 Cooper Rd Voorhees Township, NJ 08043

Details & Description
Property Highlights
• Immediate proximity to well-traveled Route 73 corridor with significant medical development related to Virtua Health
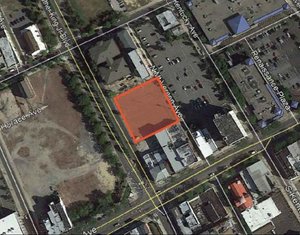
• Approximately -3.43 acres of usable land on a signalized corner intersection
Listing Agents

Corinne Giletto
O: 856-797-1919
corinne.giletto@vantageres.com
O: 856-797-1919
corinne.giletto@vantageres.com
While we strive to provide the most accurate information, all listing information, and demographic data, is provided by third-parties. As such, MyEListing will not be responsible for the accuracy of the information. It is strongly recommended that you verify all information with the listing agent, and any relevant agencies, prior to making any decisions.