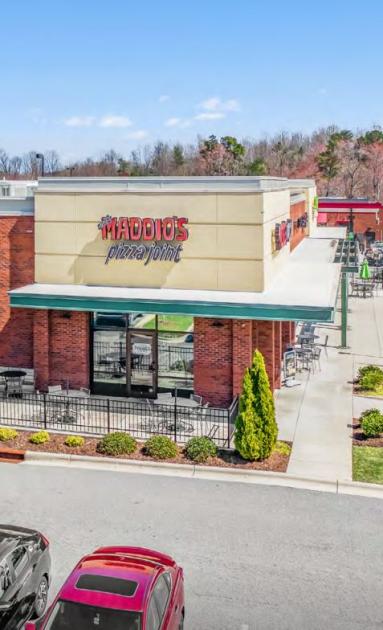
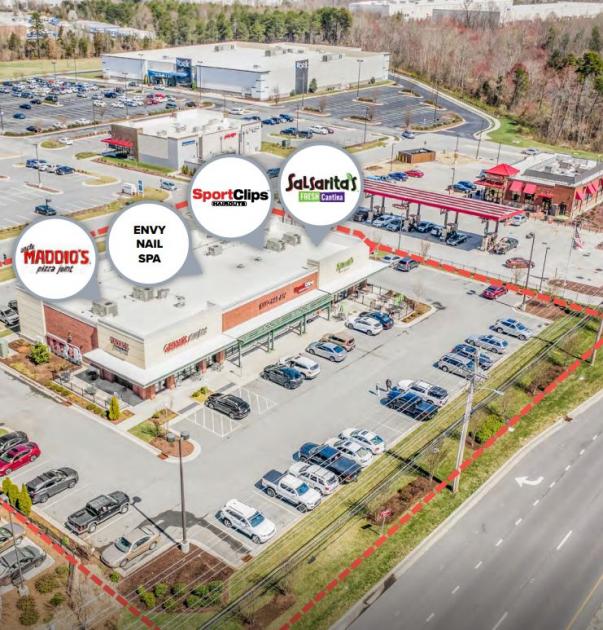
1-Mile | 3-Miles | 5-Miles | ||
---|---|---|---|---|
Total Population | 4,842 | 45,739 | 119,548 | |
Population Median Age | 38 | 39 | 38 | |
Population by Age | 0-9 Yrs | 526 (10%) | 4927 (10%) | 14134 (11%) |
10-19 Yrs | 637 (13%) | 5970 (13%) | 15976 (13%) | |
20-29 Yrs | 715 (14%) | 6165 (13%) | 18445 (15%) | |
30-39 Yrs | 686 (14%) | 6577 (14%) | 15998 (13%) | |
40-49 Yrs | 745 (15%) | 6416 (14%) | 15543 (13%) | |
50-59 Yrs | 648 (13%) | 6023 (13%) | 14773 (12%) | |
60-69 Yrs | 456 (9%) | 5203 (11%) | 12751 (10%) | |
70+ Yrs | 428 (8%) | 4458 (9%) | 11929 (9%) | |
Median HH Income | $67,568 | $69,996 | $57,059 | |
Total Household Income | < 24K | 229 (11%) | 2115 (11%) | 8439 (17%) |
25-49K | 451 (23%) | 4181 (22%) | 12646 (26%) | |
50-74K | 407 (21%) | 3726 (20%) | 9083 (19%) | |
75-99K | 277 (14%) | 2735 (14%) | 6494 (13%) | |
100-199K | 486 (25%) | 4639 (25%) | 9028 (18%) | |
200K+ | 77 (3%) | 1131 (6%) | 2090 (4%) | |
Highest Education Level | No Diploma | 220 | 1750 | 6620 |
Diploma or GED | 607 | 5315 | 17458 | |
Some College | 659 | 6463 | 17761 | |
Assoc. Degree | 298 | 2914 | 6979 | |
Bachelors Degree | 983 | 10185 | 20822 | |
Higher Degree | 639 | 5769 | 11292 | |
Total Housing Units | 2,156 | 19,938 | 52,311 | |
--Owner-Occupied | 1,166 | 11,834 | 27,456 | |
--Renter-Occupied | 762 | 6,693 | 20,325 | |
Owner-Occupied Values | < 100K | 118 | 1122 | 4896 |
100-199K | 678 | 4877 | 12655 | |
200-299K | 289 | 4051 | 6585 | |
300-399K | 63 | 1377 | 2182 | |
400-499K | 14 | 253 | 548 | |
500K+ | 4 | 153 | 591 | |
Total Working Age Population | 3,888 | 37,267 | 96,815 | |
In Work Force | 2,725 | 25,294 | 64,047 | |
Not In Work Force | 1,164 | 11,973 | 32,768 | |
Workforce Employed | 2,612 | 24,238 | 60,741 | |
Workforce Unemployed | 111 | 990 | 3,209 | |
Civlian Workforce | 2,723 | 25,227 | 63,950 | |
Military Workforce | 2 | 67 | 97 | |
Total Households | 1,928 | 18,527 | 47,781 | |
Family Households | 1,247 | 12,161 | 30,367 | |
Non-Family Households | 680 | 6,366 | 17,414 | |
Married Couple | 940 | 9,177 | 21,318 | |
Other Family | 307 | 2,984 | 9,049 | |
Married w/Child | 400 | 3,598 | 8,217 | |
Single Male w/Child | 17 | 191 | 890 | |
Single Female w/Child | 132 | 1,402 | 4,260 |
Population Change Last Two Decades - Plus Projection
2000 | % | 2010 | % | 2020 | % | 2030 | |
---|---|---|---|---|---|---|---|
North Carolina | 8,049,313 | +18 | 9,535,483 | +11 | 10,630,691 | +11 | 11,836,070 |
Davidson County | 147,246 | +11 | 162,878 | +5 | 170,888 | +8 | 184,987 |
Forsyth County | 306,067 | +15 | 350,670 | +9 | 383,123 | +9 | 418,257 |
Guilford County | 421,048 | +16 | 488,406 | +12 | 545,348 | +13 | 615,227 |
Total Working Age Population:
Total Households:
Total Working Age Population:
Total Households:
Total Working Age Population:
Total Households: