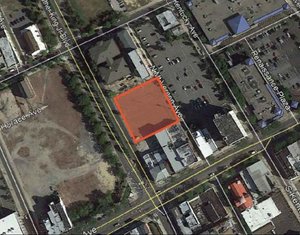
1-Mile | 3-Miles | 5-Miles | ||
---|---|---|---|---|
Total Population | 5,712 | 71,684 | 224,503 | |
Population Median Age | 41 | 41 | 40 | |
Population by Age | 0-9 Yrs | 519 (9%) | 7902 (11%) | 25645 (11%) |
10-19 Yrs | 610 (10%) | 7593 (10%) | 25128 (11%) | |
20-29 Yrs | 1131 (19%) | 10030 (13%) | 31054 (13%) | |
30-39 Yrs | 629 (11%) | 9320 (13%) | 29605 (13%) | |
40-49 Yrs | 573 (10%) | 8672 (12%) | 28518 (12%) | |
50-59 Yrs | 879 (15%) | 10233 (14%) | 32875 (14%) | |
60-69 Yrs | 714 (12%) | 9195 (12%) | 27468 (12%) | |
70+ Yrs | 657 (11%) | 8738 (12%) | 24210 (10%) | |
Median HH Income | $66,467 | $71,781 | $72,880 | |
Total Household Income | < 24K | 413 (17%) | 4295 (15%) | 13865 (15%) |
25-49K | 470 (19%) | 5517 (19%) | 16340 (18%) | |
50-74K | 464 (19%) | 4918 (17%) | 14338 (16%) | |
75-99K | 322 (13%) | 3940 (13%) | 12165 (14%) | |
100-199K | 597 (25%) | 7538 (26%) | 23610 (27%) | |
200K+ | 102 (4%) | 1957 (6%) | 6460 (7%) | |
Highest Education Level | No Diploma | 375 | 4619 | 12938 |
Diploma or GED | 1397 | 18171 | 53488 | |
Some College | 865 | 10384 | 31934 | |
Assoc. Degree | 317 | 4464 | 13251 | |
Bachelors Degree | 806 | 9870 | 32356 | |
Higher Degree | 209 | 4270 | 15462 | |
Total Housing Units | 2,580 | 30,220 | 93,668 | |
--Owner-Occupied | 1,386 | 19,552 | 59,996 | |
--Renter-Occupied | 981 | 8,614 | 26,781 | |
Owner-Occupied Values | < 100K | 49 | 987 | 4244 |
100-199K | 639 | 9884 | 28613 | |
200-299K | 569 | 6784 | 19522 | |
300-399K | 75 | 1354 | 4867 | |
400-499K | 24 | 219 | 1121 | |
500K+ | 31 | 324 | 1629 | |
Total Working Age Population | 4,755 | 59,065 | 183,114 | |
In Work Force | 3,286 | 39,863 | 124,736 | |
Not In Work Force | 1,469 | 19,202 | 58,379 | |
Workforce Employed | 3,147 | 37,492 | 117,540 | |
Workforce Unemployed | 140 | 2,361 | 7,127 | |
Civlian Workforce | 3,286 | 39,853 | 124,667 | |
Military Workforce | 0 | 10 | 69 | |
Total Households | 2,367 | 28,166 | 86,777 | |
Family Households | 1,306 | 18,339 | 56,035 | |
Non-Family Households | 1,061 | 9,827 | 30,742 | |
Married Couple | 882 | 13,030 | 39,785 | |
Other Family | 424 | 5,309 | 16,250 | |
Married w/Child | 290 | 4,757 | 15,108 | |
Single Male w/Child | 46 | 573 | 1,998 | |
Single Female w/Child | 151 | 1,551 | 5,534 |
Population Change Last Two Decades - Plus Projection
2000 | % | 2010 | % | 2020 | % | 2030 | |
---|---|---|---|---|---|---|---|
New Jersey | 8,414,350 | +4 | 8,791,894 | +4 | 9,132,700 | +4 | 9,530,900 |
Burlington County | 423,394 | +6 | 448,734 | 0 | 450,000 | +3 | 464,900 |
Camden County | 508,932 | +1 | 513,657 | 0 | 511,800 | +2 | 521,000 |
Gloucester County | 254,673 | +13 | 288,288 | +1 | 292,000 | +5 | 305,800 |
Salem County | 64,285 | +3 | 66,083 | -5 | 63,000 | -3 | 61,000 |
Pennsylvania | 12,281,054 | +3 | 12,702,379 | +4 | 13,230,170 | +4 | 13,759,594 |
Philadelphia County | 1,517,550 | +1 | 1,526,006 | +8 | 1,653,729 | +6 | 1,753,054 |
Total Working Age Population:
Total Households:
Total Working Age Population:
Total Households:
Total Working Age Population:
Total Households: