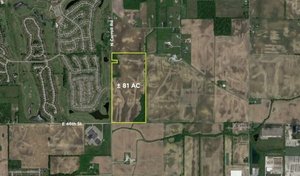
1-Mile | 3-Miles | 5-Miles | ||
---|---|---|---|---|
Total Population | 129 | 2,191 | 8,417 | |
Population Median Age | 42 | 40 | 39 | |
Population by Age | 0-9 Yrs | 8 (6%) | 213 (9%) | 991 (11%) |
10-19 Yrs | 23 (17%) | 410 (18%) | 1323 (15%) | |
20-29 Yrs | 17 (13%) | 234 (10%) | 1097 (13%) | |
30-39 Yrs | 8 (6%) | 221 (10%) | 944 (11%) | |
40-49 Yrs | 18 (13%) | 244 (11%) | 911 (10%) | |
50-59 Yrs | 25 (19%) | 366 (16%) | 1283 (15%) | |
60-69 Yrs | 20 (15%) | 261 (11%) | 975 (11%) | |
70+ Yrs | 11 (8%) | 241 (10%) | 893 (10%) | |
Median HH Income | $62,120 | $60,009 | $59,992 | |
Total Household Income | < 24K | 5 (10%) | 154 (18%) | 503 (16%) |
25-49K | 15 (31%) | 183 (21%) | 754 (24%) | |
50-74K | 16 (33%) | 237 (28%) | 742 (23%) | |
75-99K | 7 (14%) | 120 (14%) | 519 (16%) | |
100-199K | 6 (12%) | 135 (16%) | 561 (17%) | |
200K+ | 0 (0%) | 9 (1%) | 44 (1%) | |
Highest Education Level | No Diploma | 7 | 122 | 540 |
Diploma or GED | 29 | 566 | 2396 | |
Some College | 17 | 308 | 1081 | |
Assoc. Degree | 10 | 141 | 459 | |
Bachelors Degree | 23 | 218 | 671 | |
Higher Degree | 3 | 87 | 349 | |
Total Housing Units | 53 | 936 | 3,601 | |
--Owner-Occupied | 41 | 670 | 2,410 | |
--Renter-Occupied | 8 | 167 | 713 | |
Owner-Occupied Values | < 100K | 12 | 238 | 1032 |
100-199K | 19 | 296 | 984 | |
200-299K | 8 | 95 | 239 | |
300-399K | 1 | 17 | 65 | |
400-499K | 1 | 9 | 34 | |
500K+ | 0 | 15 | 57 | |
Total Working Age Population | 112 | 1,757 | 6,643 | |
In Work Force | 69 | 1,065 | 4,204 | |
Not In Work Force | 43 | 692 | 2,440 | |
Workforce Employed | 62 | 978 | 4,012 | |
Workforce Unemployed | 7 | 87 | 191 | |
Civlian Workforce | 69 | 1,065 | 4,204 | |
Military Workforce | 0 | 0 | 0 | |
Total Households | 48 | 837 | 3,123 | |
Family Households | 39 | 623 | 2,264 | |
Non-Family Households | 9 | 213 | 859 | |
Married Couple | 30 | 470 | 1,774 | |
Other Family | 9 | 154 | 490 | |
Married w/Child | 8 | 155 | 607 | |
Single Male w/Child | 0 | 9 | 65 | |
Single Female w/Child | 3 | 78 | 244 |
Population Change Last Two Decades - Plus Projection
2000 | % | 2010 | % | 2020 | % | 2030 | |
---|---|---|---|---|---|---|---|
Indiana | 6,080,485 | +7 | 6,483,802 | +4 | 6,738,573 | +4 | 7,014,880 |
Hancock County | 55,391 | +26 | 70,002 | +9 | 76,353 | +11 | 85,043 |
Henry County | 48,508 | +2 | 49,462 | -3 | 48,041 | -5 | 45,591 |
Rush County | 18,261 | -5 | 17,392 | -7 | 16,252 | -4 | 15,548 |
Total Working Age Population:
Total Households:
Total Working Age Population:
Total Households:
Total Working Age Population:
Total Households: