Commercial Land
W 600N McCordsville, IN 46055
W 600N McCordsville, IN 46055

Details & Description
Property Highlights
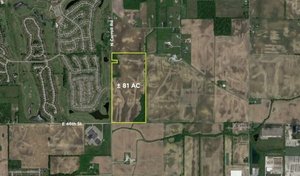
- • 30 Acres on Mount Comfort Road
- • Zoned Light Industrial I-1
- • Flat topography
- • Great Visibility in Growing Area
- • Ideal Industrial andor HQ site
Listing Agents

Michael Horrigan
O: 317-439-3452
mhorrigan@bradleyco.com
O: 317-439-3452
mhorrigan@bradleyco.com
While we strive to provide the most accurate information, all listing information, and demographic data, is provided by third-parties. As such, MyEListing will not be responsible for the accuracy of the information. It is strongly recommended that you verify all information with the listing agent, and any relevant agencies, prior to making any decisions.