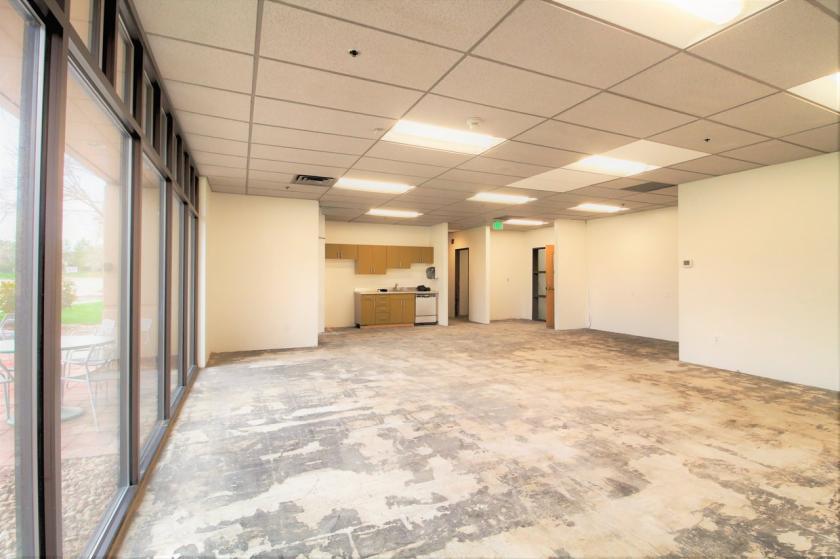
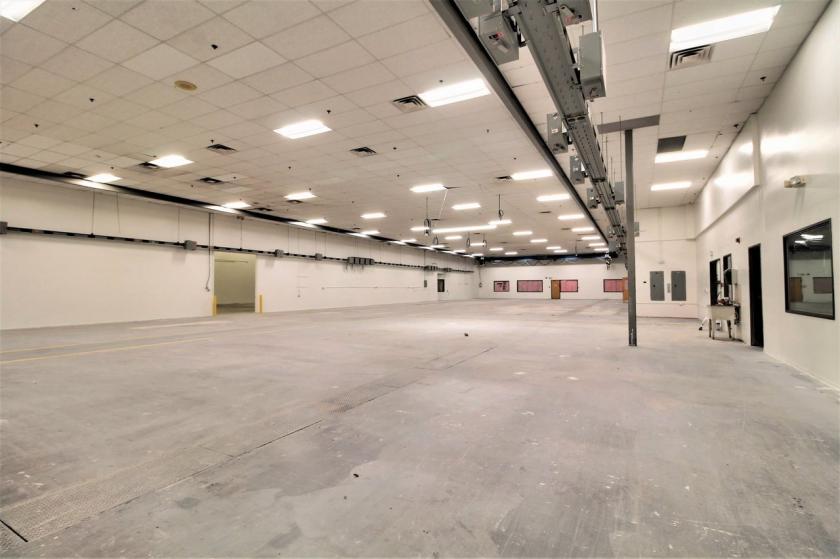
Flex-Office-Warehouse
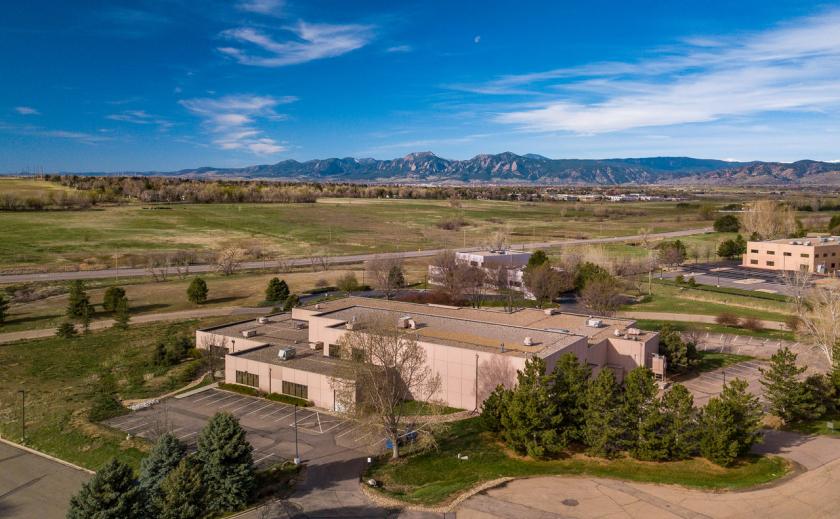
6268 Monarch Park Place Longmont, CO 80503
6268 Monarch Park Place Longmont, CO 80503
Details & Description
Property Highlights
- • 10,510 sq. ft. Office Warehouse Leased Until 2025
- • 4,000 Amps, 208V, 3-Phase Power Fully Sprinklered
- • Over 80 Parking Spaces 2.151,000 sq. ft.
Listing Agents

Angela Topel
O: 303-586-5921
angela@gibbonswhite.com
O: 303-586-5921
angela@gibbonswhite.com
While we strive to provide the most accurate information, all listing information, and demographic data, is provided by third-parties. As such, MyEListing will not be responsible for the accuracy of the information. It is strongly recommended that you verify all information with the listing agent, and any relevant agencies, prior to making any decisions.