Retail Space
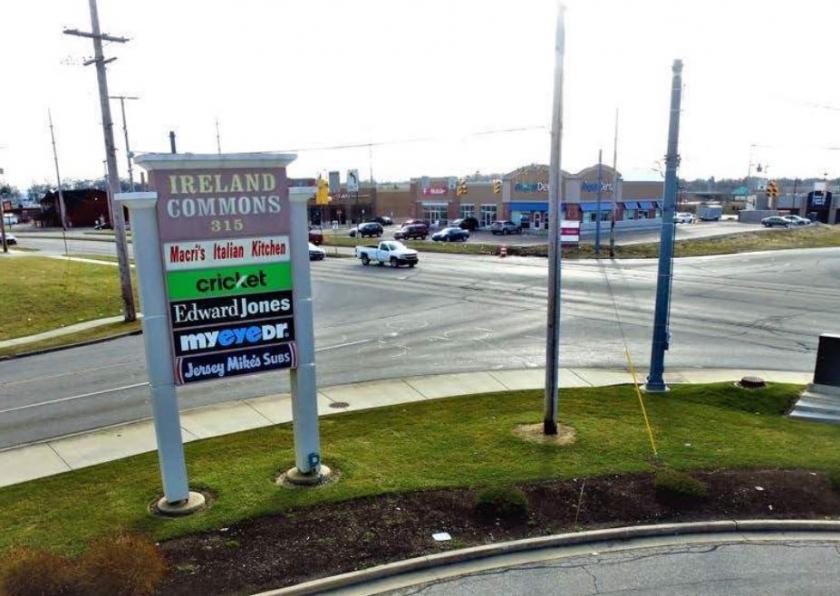
315 West Ireland Road South Bend, IN 46614
315 West Ireland Road South Bend, IN 46614
Details & Description
Property Highlights
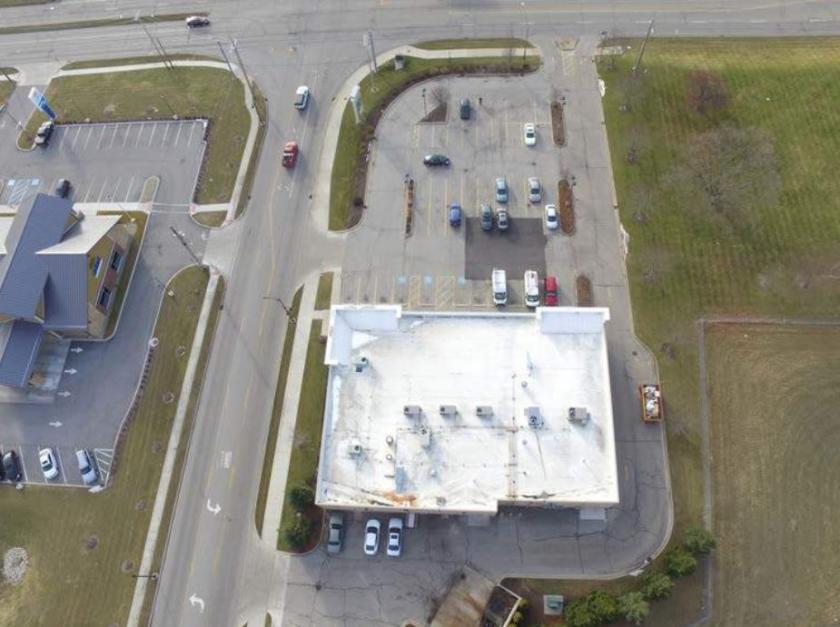
• Dense retail trade area anchored by Lowes and Walmart with daily traffic counts exceeding 22,000 vehicles
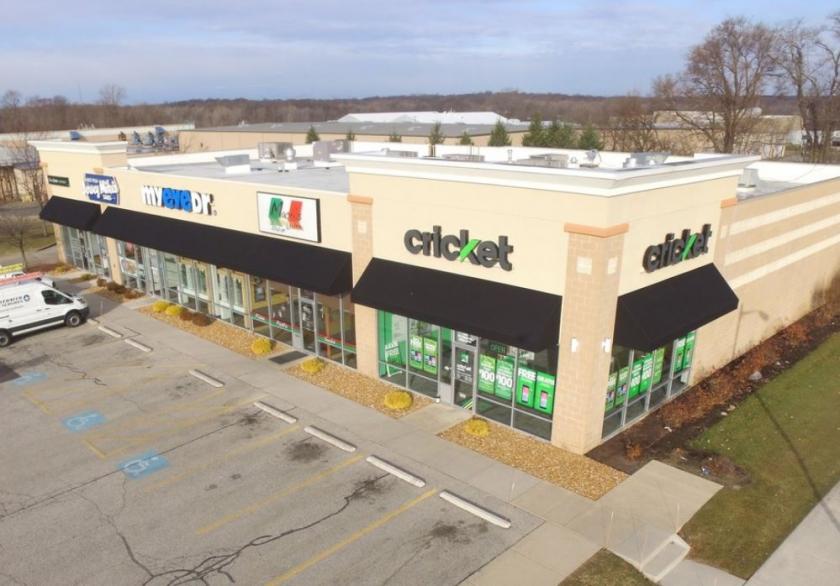
• 2,520 SF end-cap with excellent access and visibility to signalized hard corner
Listing Agents

Matt Wetzel
O: 574-970-9006
mwetzel@bradleyco.com
O: 574-970-9006
mwetzel@bradleyco.com
While we strive to provide the most accurate information, all listing information, and demographic data, is provided by third-parties. As such, MyEListing will not be responsible for the accuracy of the information. It is strongly recommended that you verify all information with the listing agent, and any relevant agencies, prior to making any decisions.