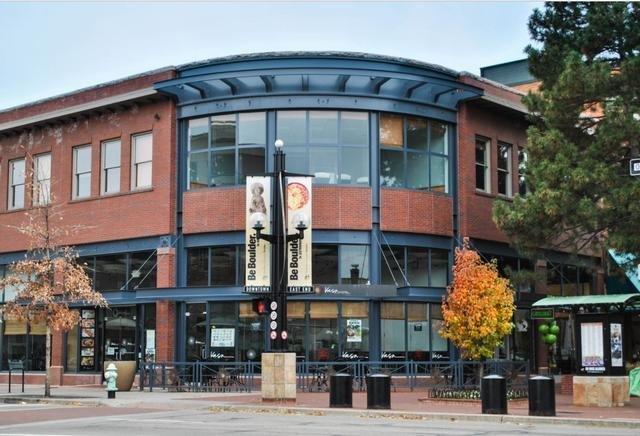
1-Mile | 3-Miles | 5-Miles | ||
---|---|---|---|---|
Total Population | 26,925 | 92,971 | 116,244 | |
Population Median Age | 32 | 35 | 36 | |
Population by Age | 0-9 Yrs | 1173 (4%) | 5537 (5%) | 7527 (6%) |
10-19 Yrs | 4249 (15%) | 14722 (15%) | 17021 (14%) | |
20-29 Yrs | 11957 (44%) | 30678 (32%) | 34493 (29%) | |
30-39 Yrs | 2930 (10%) | 11038 (11%) | 14077 (12%) | |
40-49 Yrs | 1542 (5%) | 8089 (8%) | 11474 (9%) | |
50-59 Yrs | 2050 (7%) | 8575 (9%) | 11705 (10%) | |
60-69 Yrs | 1754 (6%) | 7718 (8%) | 10884 (9%) | |
70+ Yrs | 1269 (4%) | 6614 (7%) | 9062 (7%) | |
Median HH Income | $50,754 | $65,216 | $71,425 | |
Total Household Income | < 24K | 3063 (29%) | 8374 (22%) | 9413 (20%) |
25-49K | 2025 (19%) | 6625 (18%) | 7929 (17%) | |
50-74K | 1569 (15%) | 5141 (14%) | 6721 (14%) | |
75-99K | 845 (8%) | 3355 (9%) | 4516 (9%) | |
100-199K | 1764 (17%) | 7868 (21%) | 10604 (22%) | |
200K+ | 1028 (9%) | 5160 (14%) | 7175 (15%) | |
Highest Education Level | No Diploma | 263 | 1737 | 2067 |
Diploma or GED | 555 | 3179 | 4445 | |
Some College | 1382 | 5788 | 7656 | |
Assoc. Degree | 330 | 1809 | 2679 | |
Bachelors Degree | 5021 | 18915 | 25368 | |
Higher Degree | 4912 | 20151 | 26623 | |
Total Housing Units | 11,211 | 39,253 | 49,543 | |
--Owner-Occupied | 3,175 | 17,108 | 23,764 | |
--Renter-Occupied | 7,119 | 19,415 | 22,594 | |
Owner-Occupied Values | < 100K | 45 | 1141 | 1452 |
100-199K | 124 | 890 | 1123 | |
200-299K | 73 | 698 | 1074 | |
300-399K | 202 | 1018 | 1559 | |
400-499K | 111 | 1139 | 1682 | |
500K+ | 2621 | 12222 | 16875 | |
Total Working Age Population | 25,116 | 83,580 | 103,518 | |
In Work Force | 16,356 | 55,015 | 68,536 | |
Not In Work Force | 8,760 | 28,565 | 34,982 | |
Workforce Employed | 15,540 | 52,625 | 65,566 | |
Workforce Unemployed | 800 | 2,372 | 2,953 | |
Civlian Workforce | 16,340 | 54,997 | 68,518 | |
Military Workforce | 16 | 18 | 18 | |
Total Households | 10,295 | 36,523 | 46,358 | |
Family Households | 2,932 | 14,582 | 20,188 | |
Non-Family Households | 7,362 | 21,941 | 26,170 | |
Married Couple | 2,314 | 12,001 | 16,646 | |
Other Family | 619 | 2,582 | 3,542 | |
Married w/Child | 905 | 4,903 | 6,521 | |
Single Male w/Child | 110 | 465 | 566 | |
Single Female w/Child | 230 | 879 | 1,320 |
Population Change Last Two Decades - Plus Projection
2000 | % | 2010 | % | 2020 | % | 2030 | |
---|---|---|---|---|---|---|---|
Colorado | 4,301,261 | +17 | 5,029,196 | +16 | 5,838,181 | +15 | 6,733,658 |
Boulder County | 291,288 | +1 | 294,567 | +13 | 332,134 | +12 | 370,618 |
Total Working Age Population:
Total Households:
Total Working Age Population:
Total Households:
Total Working Age Population:
Total Households: