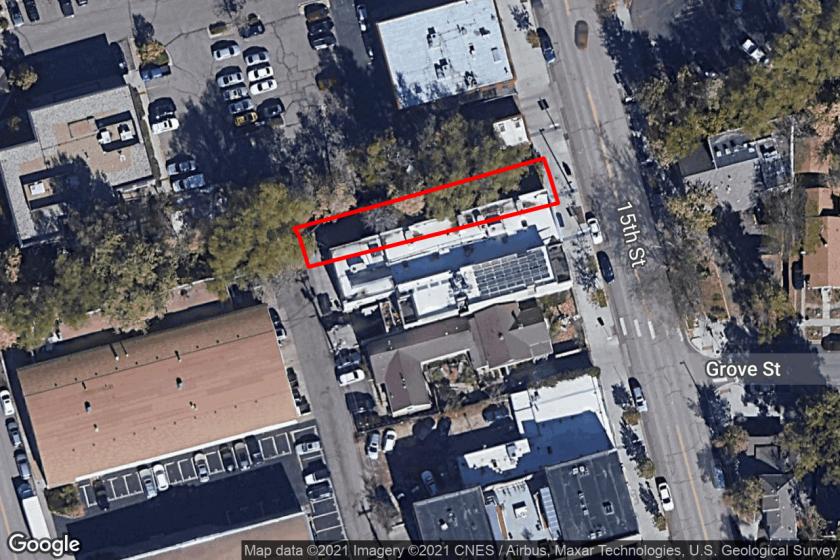
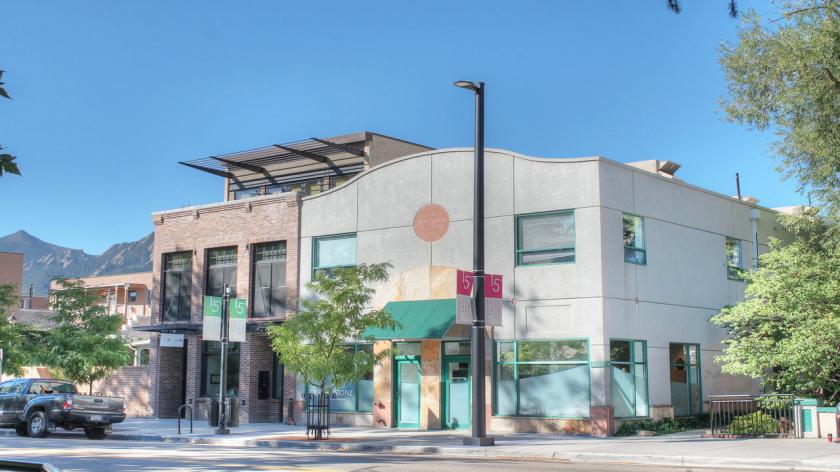
1-Mile | 3-Miles | 5-Miles | ||
---|---|---|---|---|
Total Population | 27,830 | 94,143 | 115,885 | |
Population Median Age | 30 | 35 | 36 | |
Population by Age | 0-9 Yrs | 1021 (3%) | 5629 (5%) | 7503 (6%) |
10-19 Yrs | 5276 (18%) | 14815 (15%) | 16992 (14%) | |
20-29 Yrs | 12720 (45%) | 30996 (32%) | 34426 (29%) | |
30-39 Yrs | 2767 (9%) | 11059 (11%) | 14006 (12%) | |
40-49 Yrs | 1477 (5%) | 8256 (8%) | 11402 (9%) | |
50-59 Yrs | 1864 (6%) | 8631 (9%) | 11672 (10%) | |
60-69 Yrs | 1523 (5%) | 7809 (8%) | 10848 (9%) | |
70+ Yrs | 1182 (4%) | 6947 (7%) | 9036 (7%) | |
Median HH Income | $45,942 | $65,411 | $71,379 | |
Total Household Income | < 24K | 3269 (32%) | 8402 (22%) | 9390 (20%) |
25-49K | 2063 (20%) | 6700 (18%) | 7909 (17%) | |
50-74K | 1497 (14%) | 5255 (14%) | 6692 (14%) | |
75-99K | 799 (7%) | 3412 (9%) | 4497 (9%) | |
100-199K | 1590 (15%) | 7960 (21%) | 10560 (22%) | |
200K+ | 939 (9%) | 5262 (14%) | 7149 (15%) | |
Highest Education Level | No Diploma | 224 | 1695 | 2067 |
Diploma or GED | 512 | 3242 | 4430 | |
Some College | 1267 | 5804 | 7615 | |
Assoc. Degree | 327 | 1804 | 2652 | |
Bachelors Degree | 4775 | 19255 | 25247 | |
Higher Degree | 4536 | 20601 | 26554 | |
Total Housing Units | 11,125 | 39,768 | 49,369 | |
--Owner-Occupied | 2,783 | 17,343 | 23,683 | |
--Renter-Occupied | 7,375 | 19,647 | 22,515 | |
Owner-Occupied Values | < 100K | 36 | 1144 | 1452 |
100-199K | 115 | 767 | 1113 | |
200-299K | 72 | 704 | 1065 | |
300-399K | 200 | 1033 | 1553 | |
400-499K | 117 | 1155 | 1672 | |
500K+ | 2242 | 12540 | 16828 | |
Total Working Age Population | 26,280 | 84,597 | 103,202 | |
In Work Force | 16,453 | 55,523 | 68,295 | |
Not In Work Force | 9,827 | 29,074 | 34,907 | |
Workforce Employed | 15,554 | 53,070 | 65,346 | |
Workforce Unemployed | 882 | 2,435 | 2,931 | |
Civlian Workforce | 16,436 | 55,505 | 68,277 | |
Military Workforce | 17 | 18 | 18 | |
Total Households | 10,158 | 36,990 | 46,198 | |
Family Households | 2,615 | 14,857 | 20,126 | |
Non-Family Households | 7,543 | 22,133 | 26,072 | |
Married Couple | 2,044 | 12,250 | 16,598 | |
Other Family | 571 | 2,607 | 3,528 | |
Married w/Child | 785 | 4,953 | 6,504 | |
Single Male w/Child | 72 | 475 | 564 | |
Single Female w/Child | 199 | 871 | 1,314 |
Population Change Last Two Decades - Plus Projection
2000 | % | 2010 | % | 2020 | % | 2030 | |
---|---|---|---|---|---|---|---|
Colorado | 4,301,261 | +17 | 5,029,196 | +16 | 5,838,181 | +15 | 6,733,658 |
Boulder County | 291,288 | +1 | 294,567 | +13 | 332,134 | +12 | 370,618 |
Total Working Age Population:
Total Households:
Total Working Age Population:
Total Households:
Total Working Age Population:
Total Households: