Office Space
12 Municipal Drive Fishers, IN 46038
12 Municipal Drive Fishers, IN 46038
Details & Description
Property Highlights
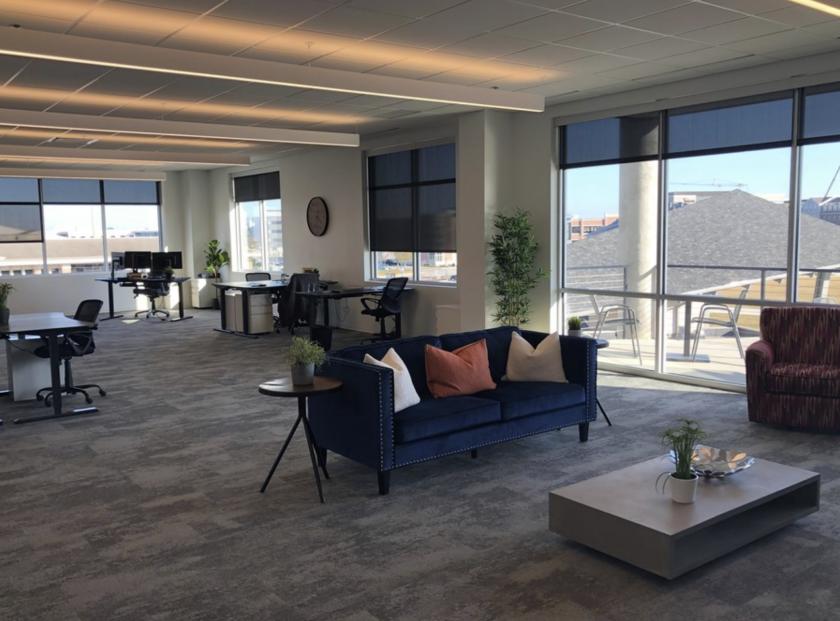
- • Large windows overlooking amphitheatercity complex
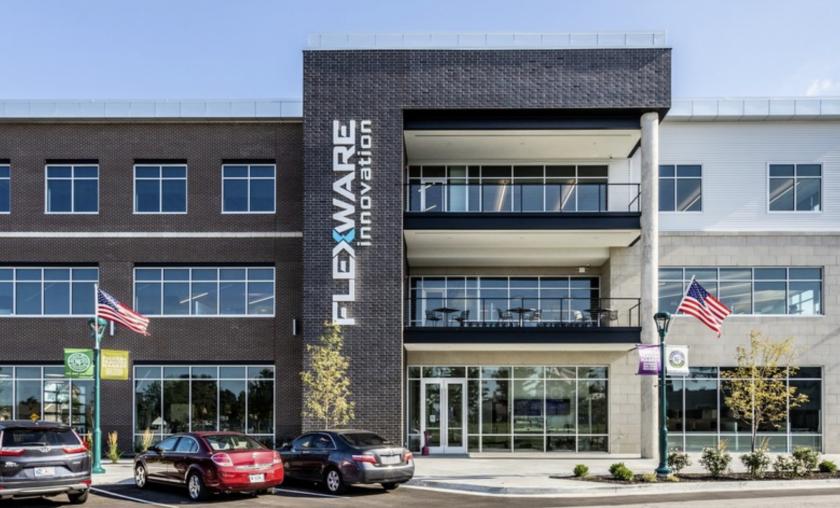
- • New, contemporary building. On-site free parking
- • Shared outside balcony
Listing Agents

Kevin Dick
O: 317-213-6692
kdick@bradleyco.com
O: 317-213-6692
kdick@bradleyco.com
While we strive to provide the most accurate information, all listing information, and demographic data, is provided by third-parties. As such, MyEListing will not be responsible for the accuracy of the information. It is strongly recommended that you verify all information with the listing agent, and any relevant agencies, prior to making any decisions.