Flex-Office-Warehouse
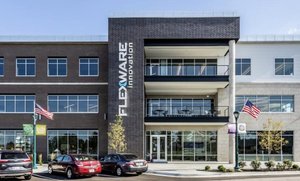
1077 3rd Avenue Southwest Carmel, IN 46032
1077 3rd Avenue Southwest Carmel, IN 46032

Details & Description
Property Highlights
- • Office 11,540 SF Warehouse 6,027 SF
- • 80 parking spaces 4.551,000 SF
- • Four drive-in doors, one dock clear height 18
Listing Agents

Kevin Dick
O: 317-213-6692
kdick@bradleyco.com
O: 317-213-6692
kdick@bradleyco.com
While we strive to provide the most accurate information, all listing information, and demographic data, is provided by third-parties. As such, MyEListing will not be responsible for the accuracy of the information. It is strongly recommended that you verify all information with the listing agent, and any relevant agencies, prior to making any decisions.