Retail Space
844 169th Street Hammond, IN 46324
844 169th Street Hammond, IN 46324

Details & Description
Property Highlights
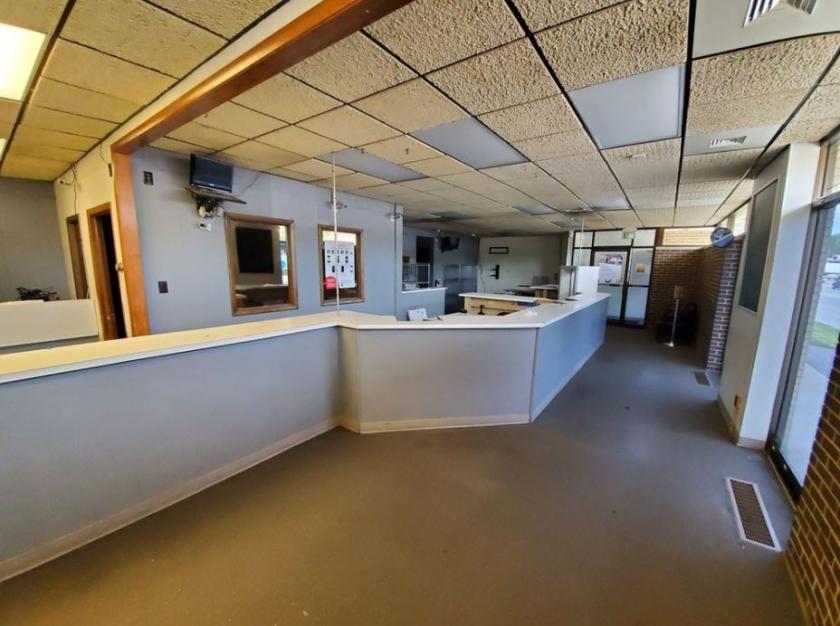
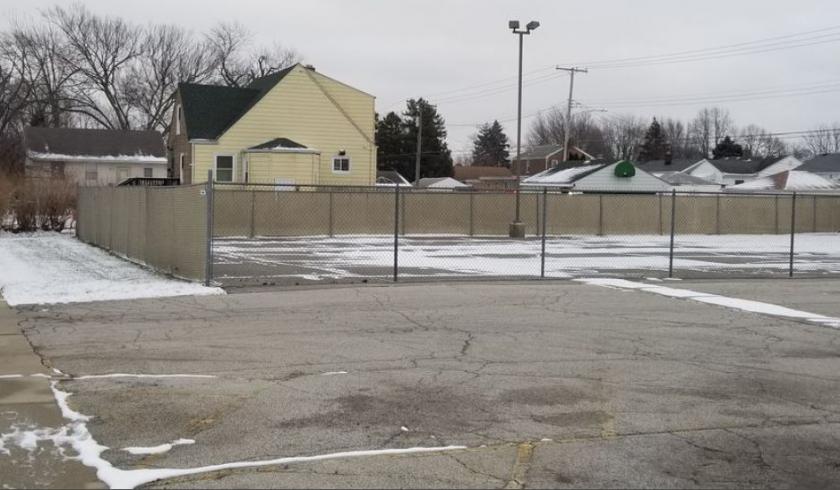
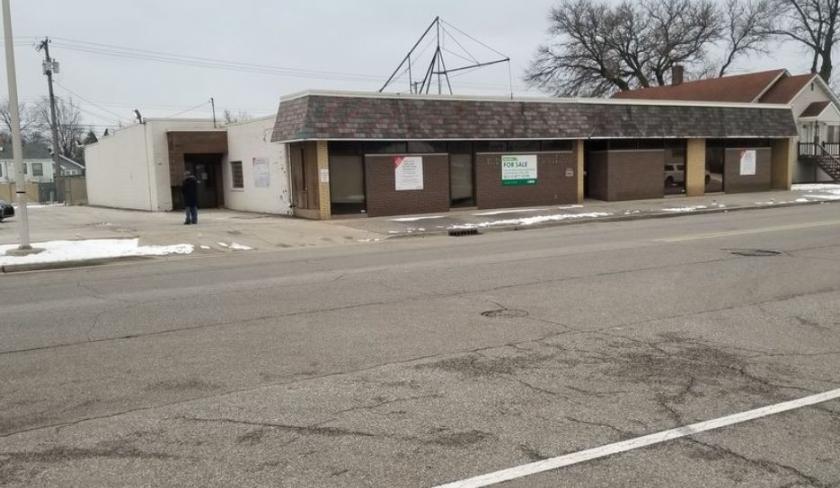
• Former 4-unit retail building converted for office use with garage storage space in rear
• Proximal to medical development including the new Saint Joseph Regional Medical Center
Additional Photos

Listing Agents

Steve Nicksic
O: 219-695-3160
M: 219-508-0554
snicksic@bradleyco.com
O: 219-695-3160
M: 219-508-0554
snicksic@bradleyco.com
While we strive to provide the most accurate information, all listing information, and demographic data, is provided by third-parties. As such, MyEListing will not be responsible for the accuracy of the information. It is strongly recommended that you verify all information with the listing agent, and any relevant agencies, prior to making any decisions.


