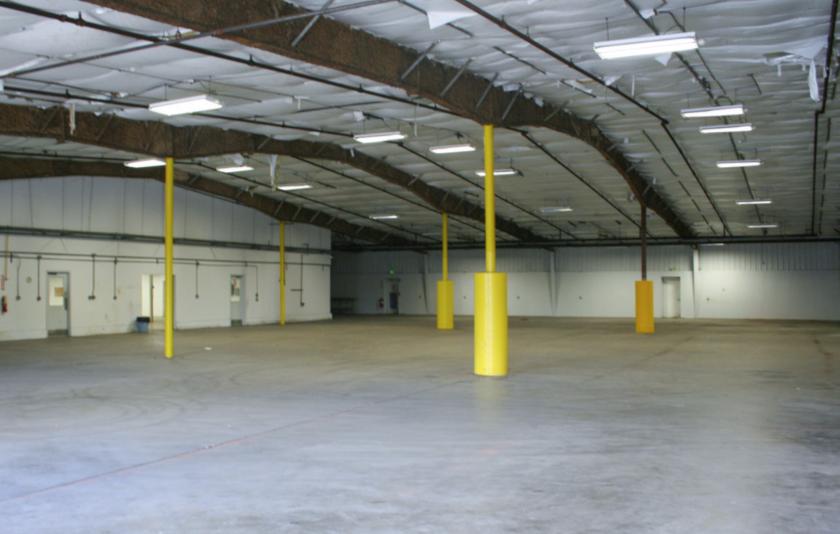
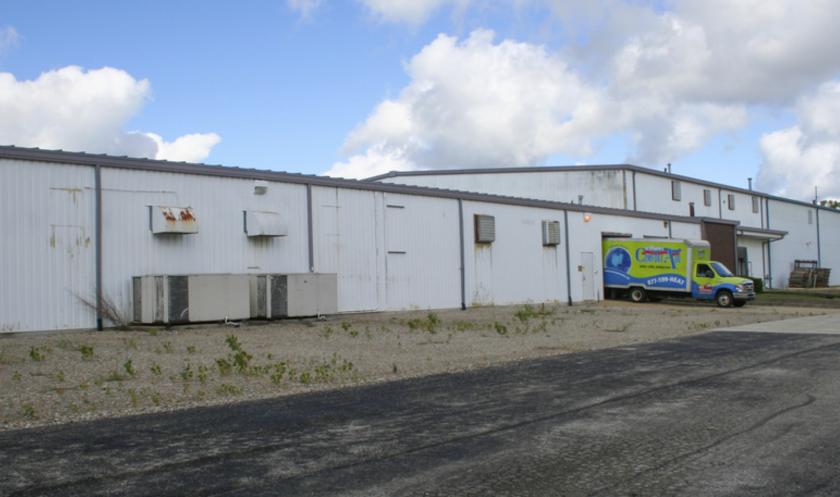
1-Mile | 3-Miles | 5-Miles | ||
---|---|---|---|---|
Total Population | 6,979 | 61,600 | 162,673 | |
Population Median Age | 35 | 36 | 36 | |
Population by Age | 0-9 Yrs | 976 (13%) | 9122 (14%) | 24487 (15%) |
10-19 Yrs | 1148 (16%) | 8564 (13%) | 22646 (13%) | |
20-29 Yrs | 991 (14%) | 8312 (13%) | 21608 (13%) | |
30-39 Yrs | 968 (13%) | 9428 (15%) | 23849 (14%) | |
40-49 Yrs | 1072 (15%) | 7731 (12%) | 19381 (11%) | |
50-59 Yrs | 801 (11%) | 8085 (13%) | 22107 (13%) | |
60-69 Yrs | 645 (9%) | 6121 (9%) | 16808 (10%) | |
70+ Yrs | 379 (5%) | 4239 (6%) | 11788 (7%) | |
Median HH Income | $73,515 | $52,719 | $53,171 | |
Total Household Income | < 24K | 309 (13%) | 6075 (25%) | 14729 (23%) |
25-49K | 438 (18%) | 5324 (22%) | 15420 (24%) | |
50-74K | 471 (19%) | 3815 (16%) | 10778 (16%) | |
75-99K | 309 (13%) | 2681 (11%) | 7141 (11%) | |
100-199K | 747 (31%) | 4893 (20%) | 11630 (18%) | |
200K+ | 99 (4%) | 936 (3%) | 3729 (5%) | |
Highest Education Level | No Diploma | 267 | 5499 | 12041 |
Diploma or GED | 904 | 11210 | 28263 | |
Some College | 787 | 7338 | 19833 | |
Assoc. Degree | 450 | 3700 | 9236 | |
Bachelors Degree | 1301 | 8355 | 24203 | |
Higher Degree | 681 | 3990 | 12604 | |
Total Housing Units | 2,566 | 26,463 | 69,747 | |
--Owner-Occupied | 2,008 | 14,436 | 37,639 | |
--Renter-Occupied | 366 | 9,287 | 25,788 | |
Owner-Occupied Values | < 100K | 196 | 3403 | 8753 |
100-199K | 1360 | 7245 | 15953 | |
200-299K | 353 | 2194 | 6703 | |
300-399K | 55 | 853 | 3226 | |
400-499K | 19 | 371 | 1271 | |
500K+ | 24 | 369 | 1733 | |
Total Working Age Population | 5,243 | 46,961 | 123,692 | |
In Work Force | 3,864 | 33,161 | 86,209 | |
Not In Work Force | 1,379 | 13,799 | 37,483 | |
Workforce Employed | 3,606 | 30,826 | 79,676 | |
Workforce Unemployed | 258 | 2,313 | 6,428 | |
Civlian Workforce | 3,864 | 33,139 | 86,104 | |
Military Workforce | 0 | 23 | 105 | |
Total Households | 2,373 | 23,723 | 63,427 | |
Family Households | 1,721 | 14,045 | 37,802 | |
Non-Family Households | 652 | 9,677 | 25,625 | |
Married Couple | 1,277 | 9,551 | 25,310 | |
Other Family | 444 | 4,494 | 12,492 | |
Married w/Child | 572 | 3,506 | 9,478 | |
Single Male w/Child | 98 | 485 | 1,182 | |
Single Female w/Child | 163 | 2,355 | 6,744 |
Population Change Last Two Decades - Plus Projection
2000 | % | 2010 | % | 2020 | % | 2030 | |
---|---|---|---|---|---|---|---|
Indiana | 6,080,485 | +7 | 6,483,802 | +4 | 6,738,573 | +4 | 7,014,880 |
Hamilton County | 182,740 | +50 | 274,569 | +25 | 343,179 | +22 | 417,754 |
Hancock County | 55,391 | +26 | 70,002 | +9 | 76,353 | +11 | 85,043 |
Marion County | 860,454 | +5 | 903,393 | +7 | 963,732 | +4 | 1,001,231 |
Total Working Age Population:
Total Households:
Total Working Age Population:
Total Households:
Total Working Age Population:
Total Households: