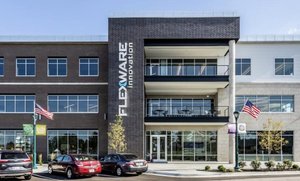
1-Mile | 3-Miles | 5-Miles | ||
---|---|---|---|---|
Total Population | 9,268 | 62,009 | 164,950 | |
Population Median Age | 37 | 37 | 38 | |
Population by Age | 0-9 Yrs | 1058 (11%) | 7442 (12%) | 20449 (12%) |
10-19 Yrs | 1412 (15%) | 9230 (14%) | 22709 (13%) | |
20-29 Yrs | 1144 (12%) | 7426 (11%) | 21281 (12%) | |
30-39 Yrs | 1429 (15%) | 9331 (15%) | 24060 (14%) | |
40-49 Yrs | 1239 (13%) | 9151 (14%) | 23736 (14%) | |
50-59 Yrs | 1424 (15%) | 9081 (14%) | 22764 (13%) | |
60-69 Yrs | 741 (7%) | 5623 (9%) | 16466 (9%) | |
70+ Yrs | 820 (8%) | 4727 (7%) | 13486 (8%) | |
Median HH Income | $84,919 | $94,399 | $92,416 | |
Total Household Income | < 24K | 281 (7%) | 1612 (6%) | 5457 (8%) |
25-49K | 799 (20%) | 4005 (16%) | 11365 (17%) | |
50-74K | 659 (16%) | 4079 (16%) | 10270 (15%) | |
75-99K | 516 (13%) | 3593 (14%) | 8832 (13%) | |
100-199K | 1320 (33%) | 8406 (33%) | 21062 (31%) | |
200K+ | 313 (8%) | 3274 (13%) | 9505 (14%) | |
Highest Education Level | No Diploma | 129 | 683 | 2458 |
Diploma or GED | 950 | 4618 | 14116 | |
Some College | 1165 | 6438 | 17298 | |
Assoc. Degree | 490 | 2782 | 7590 | |
Bachelors Degree | 2313 | 17393 | 45166 | |
Higher Degree | 1294 | 10069 | 25696 | |
Total Housing Units | 4,022 | 25,839 | 69,721 | |
--Owner-Occupied | 2,599 | 17,712 | 45,238 | |
--Renter-Occupied | 1,288 | 7,256 | 21,253 | |
Owner-Occupied Values | < 100K | 56 | 416 | 1249 |
100-199K | 1211 | 6350 | 13012 | |
200-299K | 858 | 5099 | 13472 | |
300-399K | 203 | 3140 | 9001 | |
400-499K | 90 | 1500 | 4337 | |
500K+ | 181 | 1207 | 4166 | |
Total Working Age Population | 7,309 | 48,237 | 129,362 | |
In Work Force | 5,400 | 35,995 | 95,188 | |
Not In Work Force | 1,909 | 12,242 | 34,174 | |
Workforce Employed | 5,183 | 34,955 | 92,262 | |
Workforce Unemployed | 217 | 986 | 2,766 | |
Civlian Workforce | 5,400 | 35,940 | 95,028 | |
Military Workforce | 0 | 55 | 160 | |
Total Households | 3,888 | 24,968 | 66,491 | |
Family Households | 2,480 | 16,826 | 42,830 | |
Non-Family Households | 1,408 | 8,142 | 23,661 | |
Married Couple | 1,873 | 13,890 | 35,756 | |
Other Family | 607 | 2,936 | 7,074 | |
Married w/Child | 767 | 6,602 | 16,759 | |
Single Male w/Child | 77 | 619 | 1,283 | |
Single Female w/Child | 382 | 1,453 | 3,165 |
Population Change Last Two Decades - Plus Projection
2000 | % | 2010 | % | 2020 | % | 2030 | |
---|---|---|---|---|---|---|---|
Indiana | 6,080,485 | +7 | 6,483,802 | +4 | 6,738,573 | +4 | 7,014,880 |
Hamilton County | 182,740 | +50 | 274,569 | +25 | 343,179 | +22 | 417,754 |
Hancock County | 55,391 | +26 | 70,002 | +9 | 76,353 | +11 | 85,043 |
Marion County | 860,454 | +5 | 903,393 | +7 | 963,732 | +4 | 1,001,231 |
Total Working Age Population:
Total Households:
Total Working Age Population:
Total Households:
Total Working Age Population:
Total Households: