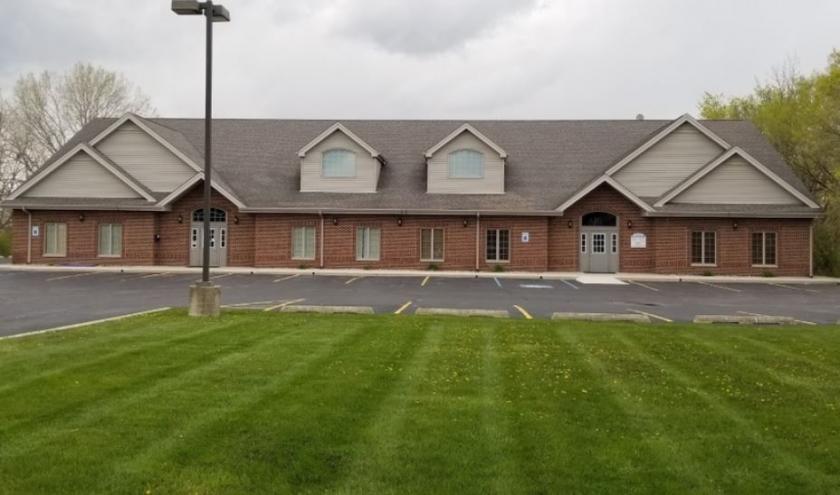
Office Space
20 East U.S. Highway 30 Schererville, IN 46375
20 East U.S. Highway 30 Schererville, IN 46375
Details & Description
Property Highlights
- • First time available on the market
- • Over 42,000 ADT traffic count
- • US 30 frontage with monument sign
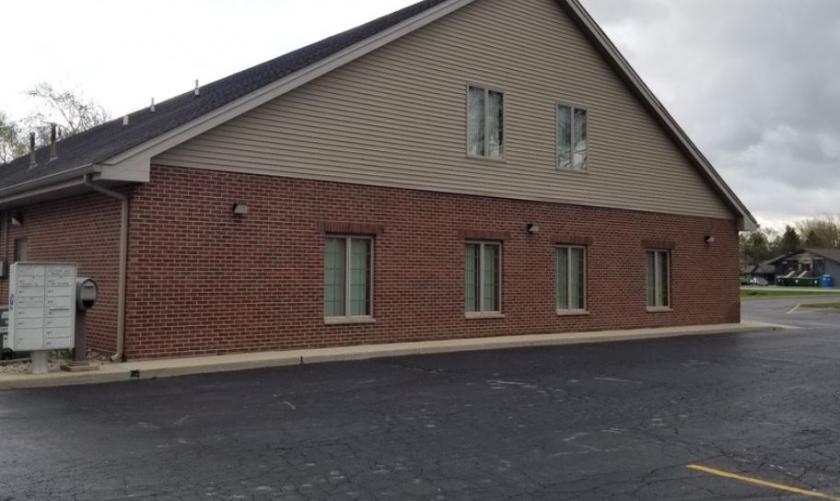
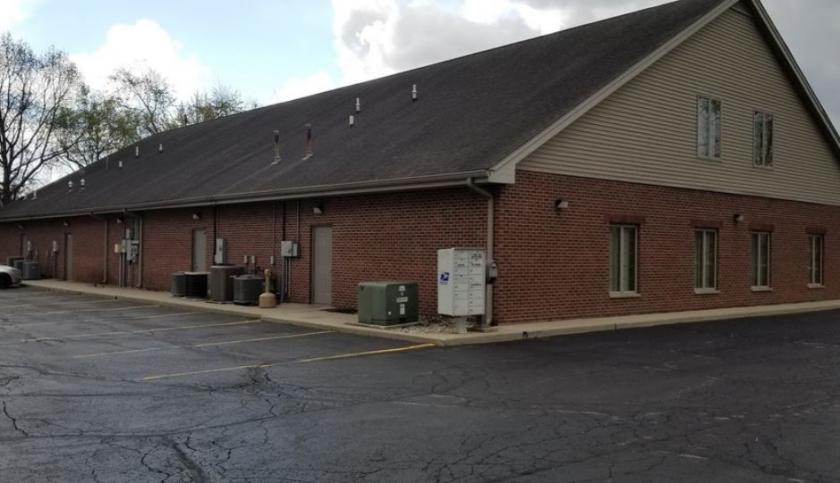
Additional Photos


Listing Agents

Steve Nicksic
O: 219-695-3160
M: 219-508-0554
snicksic@bradleyco.com
O: 219-695-3160
M: 219-508-0554
snicksic@bradleyco.com
While we strive to provide the most accurate information, all listing information, and demographic data, is provided by third-parties. As such, MyEListing will not be responsible for the accuracy of the information. It is strongly recommended that you verify all information with the listing agent, and any relevant agencies, prior to making any decisions.


