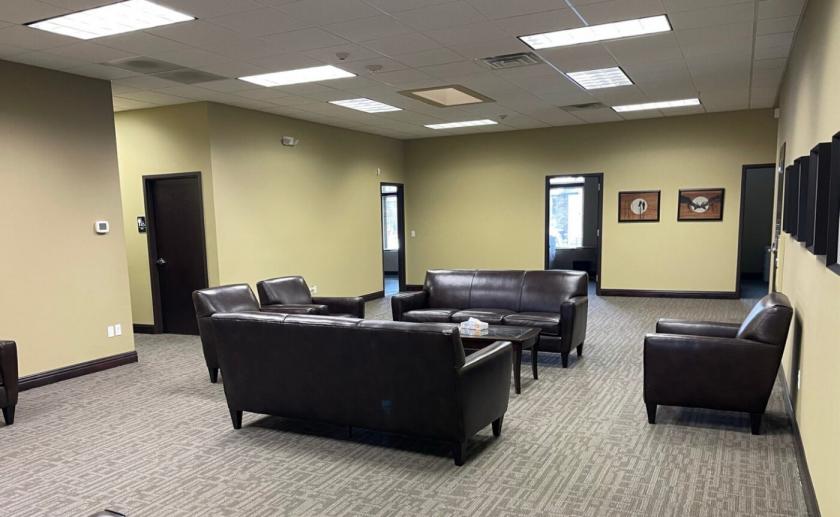
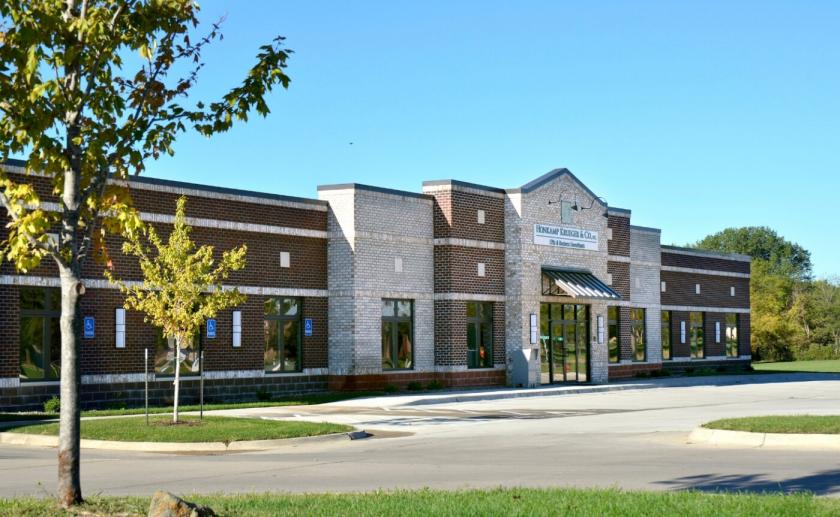
1-Mile | 3-Miles | 5-Miles | ||
---|---|---|---|---|
Total Population | 4,488 | 37,560 | 98,838 | |
Population Median Age | 39 | 39 | 38 | |
Population by Age | 0-9 Yrs | 612 (13%) | 4746 (12%) | 12532 (12%) |
10-19 Yrs | 521 (11%) | 4683 (12%) | 12697 (12%) | |
20-29 Yrs | 772 (17%) | 5003 (13%) | 13617 (13%) | |
30-39 Yrs | 439 (9%) | 5099 (13%) | 14176 (14%) | |
40-49 Yrs | 552 (12%) | 4613 (12%) | 11937 (12%) | |
50-59 Yrs | 648 (14%) | 5491 (14%) | 13385 (13%) | |
60-69 Yrs | 389 (8%) | 3908 (10%) | 10381 (10%) | |
70+ Yrs | 555 (12%) | 4016 (10%) | 10112 (10%) | |
Median HH Income | $68,237 | $69,757 | $64,006 | |
Total Household Income | < 24K | 181 (10%) | 1915 (12%) | 6103 (15%) |
25-49K | 452 (27%) | 3593 (22%) | 9646 (23%) | |
50-74K | 279 (16%) | 2940 (18%) | 7567 (18%) | |
75-99K | 236 (14%) | 2087 (13%) | 5443 (13%) | |
100-199K | 410 (24%) | 3905 (24%) | 9405 (23%) | |
200K+ | 110 (6%) | 1218 (7%) | 2386 (5%) | |
Highest Education Level | No Diploma | 254 | 1398 | 3425 |
Diploma or GED | 747 | 5237 | 15757 | |
Some College | 511 | 5201 | 14107 | |
Assoc. Degree | 368 | 2918 | 8062 | |
Bachelors Degree | 692 | 7578 | 17716 | |
Higher Degree | 228 | 3145 | 7347 | |
Total Housing Units | 1,725 | 16,444 | 43,379 | |
--Owner-Occupied | 1,269 | 11,322 | 28,769 | |
--Renter-Occupied | 399 | 4,336 | 11,782 | |
Owner-Occupied Values | < 100K | 211 | 1669 | 5344 |
100-199K | 441 | 4993 | 13835 | |
200-299K | 445 | 2655 | 5774 | |
300-399K | 87 | 964 | 2030 | |
400-499K | 51 | 575 | 963 | |
500K+ | 34 | 466 | 823 | |
Total Working Age Population | 3,567 | 29,772 | 79,008 | |
In Work Force | 2,394 | 20,654 | 54,685 | |
Not In Work Force | 1,173 | 9,118 | 24,323 | |
Workforce Employed | 2,337 | 20,023 | 52,561 | |
Workforce Unemployed | 55 | 624 | 2,100 | |
Civlian Workforce | 2,392 | 20,647 | 54,661 | |
Military Workforce | 1 | 7 | 25 | |
Total Households | 1,668 | 15,658 | 40,551 | |
Family Households | 1,176 | 9,779 | 24,380 | |
Non-Family Households | 492 | 5,879 | 16,172 | |
Married Couple | 930 | 7,664 | 18,906 | |
Other Family | 246 | 2,115 | 5,474 | |
Married w/Child | 317 | 3,065 | 7,733 | |
Single Male w/Child | 18 | 273 | 860 | |
Single Female w/Child | 162 | 1,080 | 2,602 |
Population Change Last Two Decades - Plus Projection
2000 | % | 2010 | % | 2020 | % | 2030 | |
---|---|---|---|---|---|---|---|
Iowa | 2,926,324 | +4 | 3,046,355 | -100 | |||
Linn County | 191,701 | +10 | 211,226 | -100 |
Total Working Age Population:
Total Households:
Total Working Age Population:
Total Households:
Total Working Age Population:
Total Households: